Madeleine August
Class of 2021
- Exercise Science
- Public Health Studies
Changes in Salivary Testosterone and Cortisol Indicate Optimal Recovery was Achieved in NCAA Division I Men's Soccer Athletes Between Matches 72 Hours Apart
Project Mentor:
- Titch Madzima, assistant professor of exercise science
Project Abstract
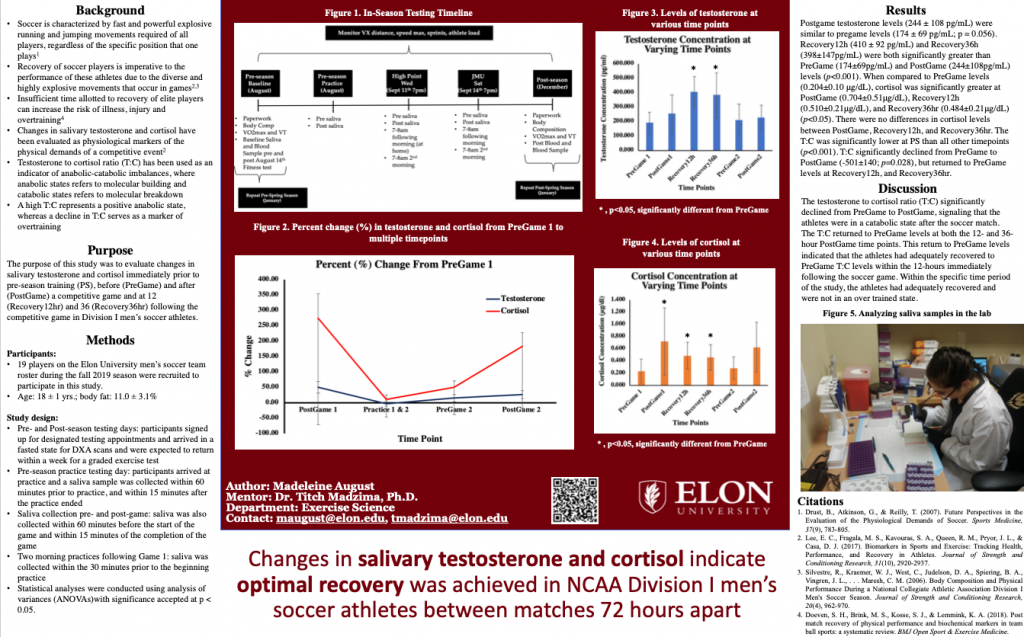
Changes in testosterone and cortisol have been evaluated as physiological markers of the physical demands of a competitive event. The testosterone to cortisol ratio (T:C) has been used as an indicator of anabolic-catabolic imbalances, where anabolic states refers to molecular building and catabolic states refers to molecular breakdown. A high T:C represents a positive anabolic state, whereas a decline in T:C serves as a marker of overtraining. PURPOSE: To evaluate changes in salivary testosterone and cortisol immediately prior to pre-season training (PS), before (PreGame) and after (PostGame) a competitive game and at 12 (Recovery12hr) and 36 hours (Recovery36hr) following the competitive game in Division 1 men’s soccer athletes. METHODS: 19 soccer athletes (age: 18±1years; body fat: 11.0±3.1%). PS salivary samples were collected in August. PreGame and PostGame salivary samples were collected an hour before the start of the fourth game of the season and within 15 minutes after the game’s completion. Recovery12hr samples were collected 12 hours later, prior to next morning practice and Recovery36hr were collected prior to the subsequent day’s practice. Salivary samples were analyzed via enzyme-linked immunosorbent assay (ELISA) to measure testosterone, cortisol and the T:C. Analysis of variances (ANOVAs) were used with significance accepted at p<0.05. RESULTS: PostGame testosterone levels (244±108pg/mL) were similar to PreGame levels (174±69pg/mL; p=0.056). Recovery12h (410±92pg/mL) and Recovery36hr (398±147pg/mL) were both significantly greater than PreGame (174±69pg/mL) and PostGame (244±108pg/mL) levels (p<0.001). When compared to PreGame levels (0.204±0.10 μg/dL), cortisol was significantly greater at PostGame (0.704±0.51μg/dL), Recovery12h (0.510±0.21μg/dL), and Recovery36hr (0.484±0.21μg/dL) (p<0.05). There were no differences in cortisol levels between PostGame, Recovery12h, and Recovery36hr. The T:C was significantly lower at PS than all other timepoints (p<0.001). T:C significantly declined from PreGame to PostGame (-501±140; p=0.028), but returned to PreGame levels at Recovery12h, and Recovery36hr. CONCLUSIONS: The PreGame to PostGame decline in T:C suggests that the demands of the game placed the athletes in a catabolic state. However, the rise in T:C back to PreGame levels at Recovery12h, and Recovery36hr indicates the athletes were able to optimally recover in the days following competition.
 Download Project Presentation