Volume 32, Issue 2: Paper 1
U.S. Public Equity ESG Fund Composite and Parnassus Core Equity Fund: Performance and Factor Attribution
Karthik Nemani and Barrett Buhler, University of North Carolina at Chapel Hill
ESG is a broad term that refers to the consideration of environmental, social, and governance standards into investors’ decisions for portfolio selections. Generally, ESG companies seek to generate positive societal byproducts as assessed by nonfinancial data such as carbon emissions, employee satisfaction, and board structure (Armstrong, 2020).
In the past several years ESG investing in the U.S. public equity market increased exponentially, surpassing $380 billion in net assets in 2021 (Lev, 2021).
Such rapid popularity was accompanied by heavy controversy, and ESG bans across the U.S. Florida Governor Ron DeSantis passed anti-ESG legislation in July 2022 that prohibited “State Board of Administration (SBA) fund managers from considering ESG factors when investing the state’s money” (Spectrum News Staff, 2022). Also in August, Texas Republican Comptroller Glenn Hegar released a list of 10 companies and 348 ESG investment funds – including BlackRock, Credit Suisse, and UBS – that were barred from doing business with the state. A year prior, Texas enacted legislation prohibiting most state agencies and local governments from contracting with such firms (Freedman, 2022).
The primary reason for such bans is the belief that the costs to financial returns outweigh the societal benefits of ESG investing. Florida anti-ESG legislation claims “…the rise of ESG investing [which] sacrifices returns at the altar of…woke agendas,” referring to ESG standards as “woke”. Furthermore, they state ESG investing “[drives] up costs for consumers in the name of diversity and [sidelines] hardworking Americans by threatening their livelihoods” (Spectrum News Staff, 2022). The Texas Republican Comptroller said, “The environmental, social and corporate governance movement has produced an opaque and perverse system in which some financial companies no longer make decisions in the best interest of their shareholders or their clients,” in a statement (Freedman, 2022).
This paper seeks to assess the validity of such statements concerning ESG by comparing the financial returns of the U.S. public equity ESG funds offered by the Forum for Sustainable and Responsible Investment’s (SIF) – the ESG Composite – institutional member firms to the S&P 500 total return index on several metrics including cumulative return, annualized return, and Sharpe ratio. It then compares the largest individual fund comprising the ESG Composite – the PRBLX portfolio – to the S&P 500 total return index on the same metrics. Next, it compares the ESG Composite and the PRBLX portfolio to the global mutual fund universe on annualized returns, annualized Sharpe ratios, annualized alphas, and annualized information ratios. Lastly, it conducts a factor analysis of the ESG Composite and the PRBLX portfolio to draw investment insights.
This paper proceeds as follows: section 3 reviews the literature, section 4 presents the data and empirical strategy, section 5 reviews the results, and section 6 concludes.
II. Literature Review
A. Establishing the Link Between ESG and Financial Performance
There are numerous papers that study the link between ESG performance and financial performance. For instance, Friede et al. (2015) use evidence from over two-thousand studies of ESG and financial performance and found that 90% of these studies contain a nonnegative relationship that remains approximately the same over time. While this study does find that there is a more positive relationship between ESG and the financial performance of bonds, it does not deny the fact that a positive relationship between ESG and the financial performance of equities exists.
Whelan et al. (2022) builds upon Friede et al. (2015) by aggregating over one-thousand studies written between 2015 and 2020. In the corporate studies primarily focused on financial performance, they found that at least 58% of them found a positive relationship between ESG and financial performance. In studies focused on risk-adjusted metrics, 33% of them found a positive relationship, 26% found a neutral relationship, 28% found mixed results, and only 14% found a negative relationship.
Preston and O’bannon (1997) established several theoretical points of view that express a direction and reason for the relationship between ESG and financial performance. These hypotheses have since been widely adopted in literature, and are as follows: social impact hypothesis, supply and demand hypothesis, trade-off hypothesis, available resources hypothesis, and the managerial opportunism hypothesis.
B. Social Impact Hypothesis
The social impact hypothesis posits that higher levels of corporate social responsibility (CSR) leads to improved financial performance. This relationship is suggested in the instrumental theories of Garriga and Melé (2004), including the well-known stakeholders’ theory, which states that corporations should strive to do right by all of their stakeholders (including employees, customers, suppliers, local communities, environmental groups, and governmental groups) to achieve true lasting success. Stakeholders’ theory is diametrically opposed to shareholders’ theory, which states that a company’s sole motivation should be to advance its shareholders’ interests (McAbee, 2022). The social impact hypothesis believes CSR procures financial performance by creating competitive advantages in the market Jain et al. (2017) improving reputation (Fombrun and Shanley, 1990), building brand image (Murray and Montanari, 1986), and strengthening legitimacy (Hart and Christensen, 2002). Particularly in terms of reputation, Cornell and Shapiro (1987) find that when a company ignores the preferences of interest groups it damages its own reputation, which inversely increases risk premium and overall financial risk. On the other hand, Cornell and Shapiro (1987) maintain that the cost of CSR is almost negligible to its potential benefits.
Most outstanding literature review supports the social impact hypothesis, such as Griffin and Mahon (1997), which found that 33 out of 51 reviewed studies describe a positive correlation between CSR and financial performance. Following this trend, Frooman (1997) found that companies deemed to be irresponsible in their social policies obtained lower profits. Orlitzky et al. (2003) obtained similar results when conducting a meta-analysis of over 50 studies between 1970 and 1997, confirming a positive relationship between socially responsible behavior and financial performance. However, Godfrey et al. (2009) noted that the reason for a positive correlation varied between results, such as the positive effect of reputation, or the different methods of measuring CSR and financial performance. Adding to the supportive findings of Orlitzky et al. (2003), Allouche and Laroche (2005) found in an analysis of 82 studies spanning the U.S. and the U.K. that CSR has a positive effect on financial results, with a greater effect measured in the U.K. Tang et al. (2012) also validated the social impact hypothesis, but only when the CSR is adopted as a consistent strategy. In emerging economies, Mishra and Suar (2010) find that CSR strategies prioritizing stakeholders’ theory can be profitable to Indian firms. Hebb et al. (2016) revealed empirical evidence about the positive relationship between CSR and aspects such as degree of CSR awareness and stakeholder pressure in Spain. Therefore, it can be concluded that there exists a positive relationship between CSR and financial performance, where CSR is the driving force or independent variable of the relationship.
C. Supply and Demand Hypothesis
The supply and demand hypothesis posits that there is no clear link between social and financial performance, as pointed out by McWilliams and Siegel (2001).
Roman et al. (1999) find support for this hypothesis in just 14 of 52 studies reviewed dealing with this relationship. Margolis and Walsh (2003) found evidence for a weak relationship between CSR and financial results in an analysis of 127 studies, in which 31 found it to be either absent or nonsignificant. Van Beurden and Gossling (2008) found nine studies with neutral results, including those by Bowman (1978), Aupperle et al. (1985), Freedman and Jaggi (1986), Fombrum and Shanley (1990), Ruf et al. (2001), and Seifert et al. (2004). There were also studies that found a relationship but reached contradictory conclusions, finding that the relationship is either indeterminate or neutral, according to whether it is positive or negative. Griffin and Mahon (1997) found 9 studies with mixed results out of 51, and in the work of Margolis and Walsh (2003) there were 23 out of 27.
D. Trade-Off Hypothesis
According to the trade-off hypothesis, higher CSR levels lead to lower financial performance. Friedman (1970) argues that businesses have no responsibilities other than achieving the highest possible profits, so investing in CSR involves an extra cost that placed a company at a disadvantage in relation to its competitors and also brings in lower profits.
Very few authors found a negative relationship between CSR and financial results in their investigations. Some of the most important empirical studies that did so were those by Brammer et al. (2006) and Van der Laan et al. (2008).
E. Available Resources Hypothesis
The available resources hypothesis links good financial performance with high levels of CSR. According to Waddock and Graves (1997), good financial results mean that money can be invested in CSR, so that high profits could be a good indicator of subsequent good social results.
Of the above-mentioned reviews, that by Margolis and Walsh (2003) is the one that concentrates most on studies that consider social responsibility as a dependent variable. Of a total of 22 of this type, 16 found a positive correlation, i.e., good financial performance leads to the adoption of CSR; 3 found the correlation to be nonsignificant, and a further 3 found it to be bidirectional. Studies such as those by McGuire et al. (1988, 1990) provide empirical support for this hypothesis.
F. Managerial Opportunism Hypothesis
The managerial opportunism hypothesis considers that higher financial performance levels lead to lower CSR levels. Authors such as Person and O’bannon (1997) argue that directors may act to increase their personal benefits and reduce investment in CSR when profit levels are high. Similarly, if profits are low, directors may attempt to justify the situation by blaming ambitious social programs. This hypothesis is empirically validated in the work of Posner and Schmidt (1992).
G. Gaps in Literature
Although a substantial number of studies show a positive relationship between financial performance and individual companies exhibiting CSR strategies, few look at the landscape of ESG funds, which compile such companies to build an entire portfolio. Furthermore, the scope of “positive financial performance” is loosely defined and often differing in many studies, with no standard benchmark for returns to be compared with. Some studies have compared ESG funds with a benchmark, but these funds also hold international equities or bonds and inaccurately compare them to the U.S. public equity-based S&P 500. This study compares a list of 70 U.S. public equity ESG funds to the S&P 500 to maintain the “apples-to-apples” theme and generate tangible, consistent metrics of performance.
III. Data and Empirical Strategy
A. U.S. SIF
The ESG Composite is formed by filtering public equity ESG funds offered by the U.S. SIF member firms. The U.S. SIF is the leading voice in advancing sustainable investing across all asset classes with the mission to “rapidly shift investment practices toward sustainability, focusing on long-term investment and the generation of positive social and environmental impacts.” Institutional members of the U.S. SIF manager $5 trillion in assets under management (AUM), and include investment management firms, advisory firms, mutual fund companies, assets owners and broker-dealers, among others. The U.S. SIF is supported by the U.S. SIF Foundation, a 501(c)(3) nonprofit organization that seeks to educate, research and propel the mission of U.S. SIF (US SIF, 2022).
B. ESG Composite
The ESG Composite was created by filtering U.S. SIF Sustainable Investment Mutual Funds and ETFs Chart to all U.S. public equity ESG funds on the database.
C. ESG Composite, PRBLX, & Mutual Funds Returns Data
Annual total returns of over 23,000 active equity mutual funds through the year 2020 were scraped from YahooFinance and accumulated into one dataset, linked here: https://www.kaggle.com/datasets/stefanoleone992/mutual-funds-and-etfs/versions/3?resource=download. This dataset is available to the public, along with https://finance.yahoo.com. This dataset was filtered for over 10,000 active equity mutual funds that were operative during some period between January 2005 and December 2020. The ESG Composite was further filtered from this list to the 70 funds from on the U.S. SIF database, and annual total returns of each fund from 2005 to 2020 were provided. Annual total returns data for the PRBLX portfolio were provided by Yahoo Finance, linked here: https://finance.yahoo.com/quote/PRBLX/performance?p=PRBLX. Annual total returns data for the S&P 500 total return index were provided by YahooFinance, linked here: https://finance.yahoo.com/quote/%5EGSPC/history?p=%5EGSPC. Methods for calculating returns can be found in the appendix.
D. Calculating ESG Composite Returns
Unlike the PRBLX portfolio and S&P 500, the ESG Composite was a list of funds. A simple average or median of list returns were susceptible to high volatility from small funds, so a weighted average based on NAV was used. The total NAV of the ESG Composite was calculated by summing each NAV, and then a proportion was calculated by dividing fund-specific NAV by the sum. Finally, the proportion was multiplied by annual total return for each fund per year, and year-specific values were summed to create NAV-weighted annual total returns for the ESG Composite.
E. Factor Data and Analysis
In factor analysis of the ESG Composite and PRBLX portfolio excess returns (Rp,t – Rf,t), several specifications and regressions are provided using popular academic factors, with data from January 2005 to December 2020. This includes the CAPM (Equation 1) regressing the ESG Composite and PRBLX portfolio excess returns on a leverage factor (MKT-Rf) defined by the S&P 500 minus the risk-free 3-month T-bill rate:
(1) (Rp,t – Rf,t) = α + β* (Rm,t – Rf,t) + εt
The analysis also includes a Fama-French (1993) Three Factor Model (Equation 2) that regresses the ESG Composite and PRBLX portfolio excess returns on a leverage factor (MKT-Rf) in addition to size (SMB) and value (HML) factors obtained from the Ken French data library:
(2) (Rp,t – Rf,t) = α + βMKT* (Rm,t – Rf,t) + βSMB * SMBt + βHML * HMLt + εt
Another specification is provided using the Carhart (1997) Four Factor Model (Equation 3) that includes a momentum factor (UMD), also obtained from the Ken French data library:
(3) (Rp,t – Rf,t) = α + βMKT* (Rm,t – Rf,t) + βSMB * SMBt + βHML * HMLt + βUMD * UMDt + εt
In separate specifications, this study also regresses the PRBLX portfolio excess returns on the Frazzini and Pedersen (2014) Betting-Against-Beta factor and the Asness et al. (2013) Quality Minus Junk (QMJ) factor.
F. Synthetic Portfolio Construction
Systematic synthetic portfolios are constructed from the same regressions of monthly returns in Table 3 and Table 4, namely the Four Factor regression using data over the entire time period (January 2005 to December 2020). The portfolio is rebalanced annually at year-end to keep constant weights. The explanatory variables are the monthly returns of the standard size, value, and momentum factors.
IV. Results
A. ESG Composite versus S&P 500
Table 1 below displays the side-by-side performance of the ESG Composite and the S&P 500 total return index.
Table 1. Summary Statistics for the ESG Composite Versus the S&P 500
| Time Period | ESG Composite Return | S&P 500 Total Return |
|---|---|---|
| 2005 | 2.47% | 4.83% |
| 2006 | 10.03% | 15.61% |
| 2007 | 5.58% | 5.49% |
| 2008 | -26.20% | -36.55% |
| 2009 | 26.71% | 25.93% |
| 2010 | 13.83% | 14.82% |
| 2011 | -0.31% | 2.10% |
| 2012 | 13.78% | 15.89% |
| 2013 | 30.26% | 32.04% |
| 2014 | 11.38% | 13.52% |
| 2015 | -0.53% | 1.37% |
| 2016 | 10.87% | 11.76% |
| 2017 | 19.57% | 21.60% |
| 2018 | -3.63% | -4.23% |
| 2019 | 30.77% | 31.19% |
| 2020 | 21.18% | 18.05% |
| Summary Statistics | ESG Composite Return | S&P 500 Total Return |
|---|---|---|
| Cumulative Return (01/01/2005 – 12/31/2020) | 319.19% | 325.06% |
| Annualized Return | 10.04% | 10.13% |
| Standard Deviation | 14.51% | 16.40% |
| Downside Deviation | 12.45% | 22.85% |
| Sharpe Ratio | 0.60 | 0.54 |
| Sortino Ratio | 0.70 | 0.39 |
| Active Return (vs. S&P 500 Total Return) | -0.09% | |
| Tracking Error (vs. S&P 500 Total Return) | 3.45% | |
| Information Ratio (vs. S&P 500 Total Return) | -0.03 |
On cumulative return, the ESG Composite is less than the S&P 500, at 319.91% and 325.06%, respectively. Annualized return of the ESG Composite is approximately equal to the S&P 500, with a difference of 0.09%. Standard deviation of the ESG Composite is less than the S&P 500, with a difference of 1.89%. Downside deviation of the ESG Composite is much lower than the S&P 500, with a difference of 10.4%. Sharpe ratio of the ESG Composite is slightly greater than the S&P 500, with a difference of 0.06. However, Sortino ratio of the ESG Composite is nearly double the S&P 500, with a difference of 0.31. Active return and Information Ratio of the ESG Composite are both negative, but tracking error is relatively low at 3.45%.
Figure 1 below displays the ESG Composite and S&P 500 cumulative returns tracked from 2005 to 2020.
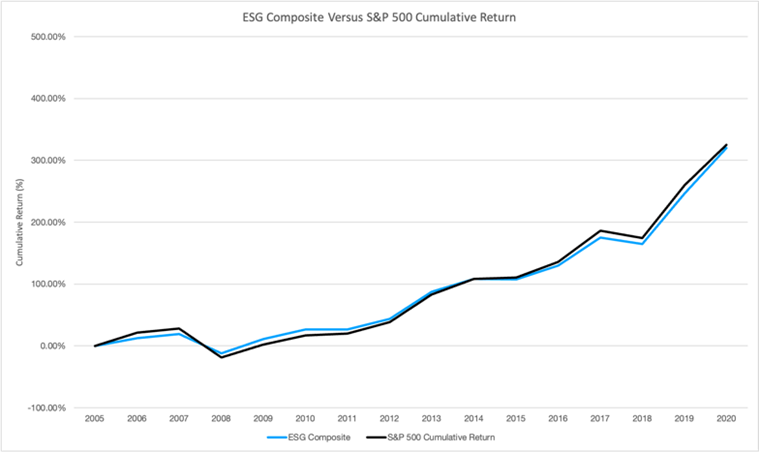
Figure 1. ESG Composite Versus S&P 500 Cumulative Returns
Table 2 below displays the side-by-side performance of the PRBLX portfolio and the S&P 500 total return index.
The PRBLX portfolio has a significantly greater cumulative return than the S&P 500, at 436.10% versus 325.06%, respectively. Annualized return of the PRBLX portfolio is also greater than the S&P 500, with a difference of 1.71%. Standard deviation of the PRBLX portfolio is less than the S&P 500, with a difference of 2.36%. Downside deviation of the ESG Composite is significantly lower than the S&P 500, with a difference of 12.2%. Sharpe ratio of the ESG Composite is greater than the S&P 500, with a difference of 0.21. Furthermore, Sortino ratio of the PRBLX is over double the S&P 500, with a difference of 0.6. Active return and Information Ratio of the PRBLX portfolio are both positive, indicating outperformance over the S&P 500. Tracking error is still low at 4.84%.
Table 2. Summary Statistics for the PRBLX Portfolio Versus the S&P 500
| Time Period | PRBLX Portfolio Return | S&P 500 Total Return |
|---|---|---|
| 2005 | 2.62% | 4.83% |
| 2006 | 14.70% | 15.61% |
| 2007 | 14.13% | 5.49% |
| 2008 | -22.96% | -36.55% |
| 2009 | 28.75% | 25.93% |
| 2010 | 8.87% | 14.82% |
| 2011 | 3.13% | 2.10% |
| 2012 | 15.43% | 15.89% |
| 2013 | 33.98% | 32.04% |
| 2014 | 14.49% | 13.52% |
| 2015 | -0.55% | 1.37% |
| 2016 | 10.41% | 11.76% |
| 2017 | 16.58% | 21.60% |
| 2018 | -0.18% | -4.23% |
| 2019 | 30.69% | 31.19% |
| 2020 | 21.19% | 18.05% |
| Summary Statistics | PRBLX Portfolio Return | S&P 500 Total Return |
|---|---|---|
| Cumulative Return (01/01/2005 – 12/31/2020) | 436.10% | 325.06% |
| Annualized Return | 11.84% | 10.13% |
| Standard Deviation | 14.04% | 16.40% |
| Downside Deviation | 10.65% | 22.85% |
| Sharpe Ratio | 0.75 | 0.54 |
| Sortino Ratio | 0.99 | 0.39 |
| Active Return (vs. S&P 500 Total Return) | 1.72% | |
| Tracking Error (vs. S&P 500 Total Return) | 4.84% | |
| Information Ratio (vs. S&P 500 Total Return) | 0.35 |
Figure 2 below displays the PRBLX portfolio and S&P 500 cumulative returns tracked from 2005 to 2020.
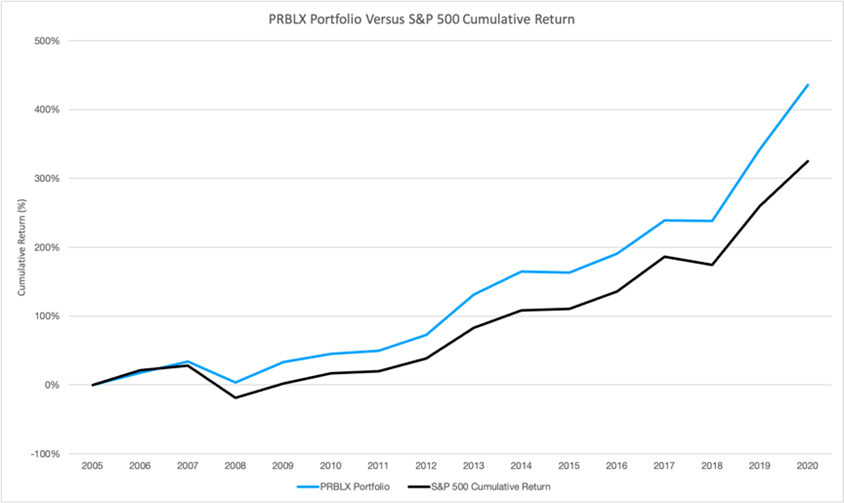
Figure 2. PRBLX Portfolio Versus S&P 500 Cumulative Returns
B. Versus Global Mutual Fund Universe
Figure 3 below shows where the ESG Composite (vertical red dashed line) compares against the distribution of annualized returns, Sharpe ratios, alphas, and information ratios of all actively managed equity funds operative between 2005 and 2020.
Figure 3a shows the ESG Composite in the higher ranges of annualized Sharpe ratio amongst the mutual fund universe.
Figure 3b shows the ESG Composite in the higher ranges of annualized returns amongst the mutual fund universe. Figure 3c shows the ESG Composite near the center of the annualized alphas amongst the mutual fund universe. Figure 3d shows the ESG Composite near the lower ranges of annualized information ratios amongst the mutual fund universe.
Figure 4 below shows where the PRBLX portfolio (vertical black dashed line) compares against the distribution of annualized returns, Sharpe ratios, alphas, and information ratios of all actively managed equity funds operative between 2005 and 2020.
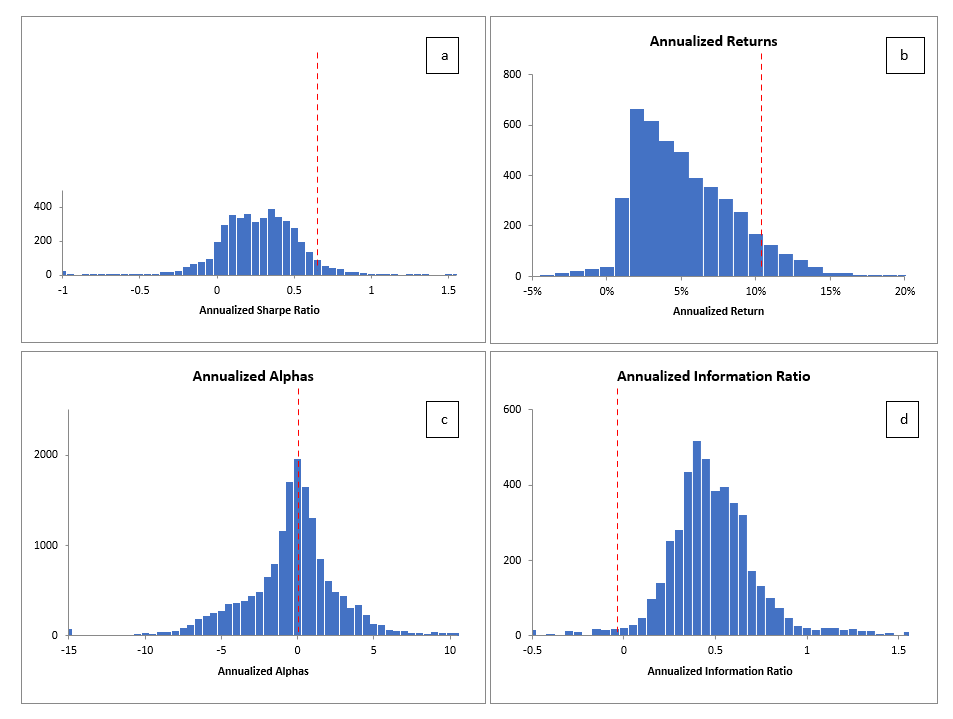
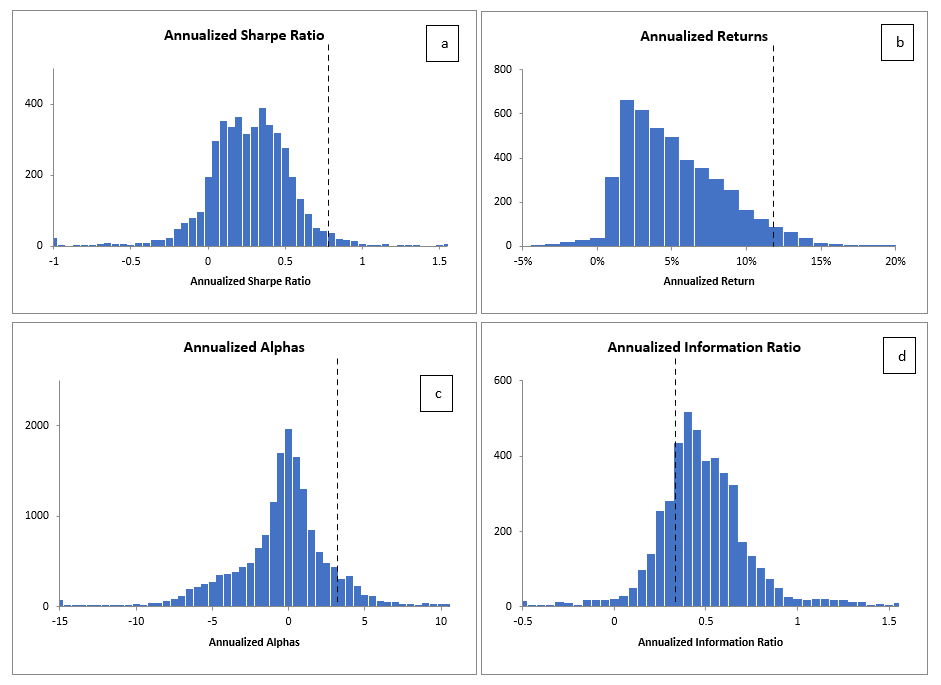
Figure 4. PRBLX Portfolio Compared to YahooFinance Mutual Fund Universe (Jan. 1, 2005 – Dec. 31, 2020)
Figure 4a shows the PRBLX portfolio in the higher ranges of annualized Sharpe ratio amongst the mutual fund universe.
Figure 4b shows the PRBLX portfolio in the higher ranges of annualized returns amongst the mutual fund universe. Figure 4c shows the PRBLX portfolio near the center of the annualized alphas amongst the mutual fund universe. Figure 4d shows the PRBLX portfolio near the lower ranges of annualized information ratios amongst the mutual fund universe.
C. Factor Attribution
Table 3 below displays the results of factor regression of the ESG Composite.
Table 3. ESG Composite Exposures: What Kind of Companies Do U.S. Public Equity ESG Funds Own?
| CAPM | Fama-French (1993) | Carhart (1997) | Frazzini-Pedersen (2014) | Asness-Frazzini-Pedersen (2013) | |
|---|---|---|---|---|---|
| Alpha | 0.497%(0.491) | 0.074%(0.932) | 0.283%(0.754) | 0.226%(0.716) | -0.283%(0.738) |
| MKT-Rf | 0.834***(~0) | 0.868***(~0) | 0.850***(~0) | 0.951***(~0) | 0.979***(~0) |
| SMB | -0.066(0.543) | -0.097(0.397) | -0.163*(0.063) | -0.123(0.201) | |
| HML | 0.031(0.376) | 0.026(0.457) | 0.013(0.601) | 0.002(0.955) | |
| UMD | -0.031(0.338) | -0.027(0.235) | -0.030(0.196) | ||
| BAB | -2.218***(0.004) | -2.242***(0.005) | |||
| QMJ | 0.930 (0.381) |
Alpha values for the Capital Asset Pricing Model (CAPM), Fama-French, Carhart, Frazzini-Pedersen, and Asness-Frazzini-Pedersen equations are statistically insignificant. Thus, no conclusions can be drawn from them. Traditional leverage factor betas (MKT- Rf) are statistically significant on the 1% scale across all equations, ranging from 0.834 to 0.979. Small minus big (SMB) factor beta is statistically significant at the 10% scale, with a negative value of -0.163. Betting-against-beta (BAB) factor betas are statistically significant at the 1% scale in both equations that incorporate them, with values less than -2.2.
Table 4 below displays the results of factor regression of the ESG Composite.
Alpha values for the CAPM, Carhart, and Frazzini-Pedersen equations are statistically significant, with values around 2.6%. Traditional leverage factor betas (MKT- Rf) are statistically significant on the 1% scale across all equations, ranging from 0.779 to 0.950. Small minus big (SMB) factor beta is statistically significant at the 10% scale, with a negative value of -0.332. Betting-against-beta (BAB) factor betas are statistically significant at the 1% scale in both equations that incorporate them, with values less than -2.6.
Table 4. PRBLX Portfolio Exposures: What Kind of Companies Does the PRBLX Portfolio Own?
| CAPM | Fama-French (1993) | Carhart (1997) | Frazzini-Pedersen (2014) | Asness-Frazzini-Pedersen (2013) | |
|---|---|---|---|---|---|
| Alpha | 2.66%** (0.039) |
2.26%(0.133) | 2.66%* (0.086) |
2.60%* (0.061) |
1.64% (0.357) |
| MKT-Rf | 0.779*** (~0) |
0.815*** (~0) |
0.778*** (~0) |
0.898*** (~0) |
0.950*** (~0) |
| SMB | -0.195 (0.284) |
-0.255 (0.177) |
-0.332* (0.063) |
-0.258 (0.194) |
|
| HML | 0.018 (0.744) |
0.009 (0.871) |
-0.007 (0.8916) |
-0.027 (0.625) |
|
| UMD | -0.061 (0.247) |
-0.056 (0.2268) |
-0.063 (0.196) |
||
| BAB | -2.609* (0.0617) |
-2.655* (0.064) |
|||
| QMJ | 1.748 (0.421) |
D. Synthetic Portfolio Adjustment
Figure 5 below shows calendar-time returns of a synthetic portfolio of the ESG Composite that uses the factor loadings as estimated from factor regression analysis.
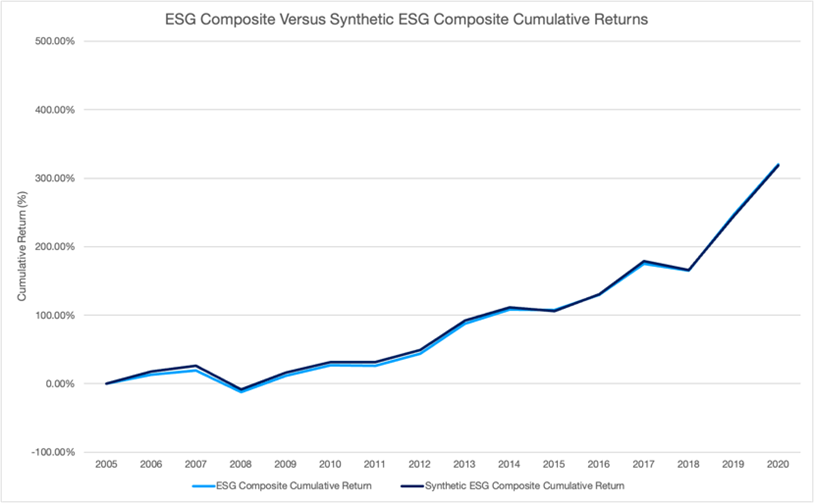
Figure 5. ESG Composite vs. Synthetic ESG Composite Cumulative Returns
Figure 6 below shows a zoomed view of the calendar-time returns of the synthetic ESG Composite portfolio.
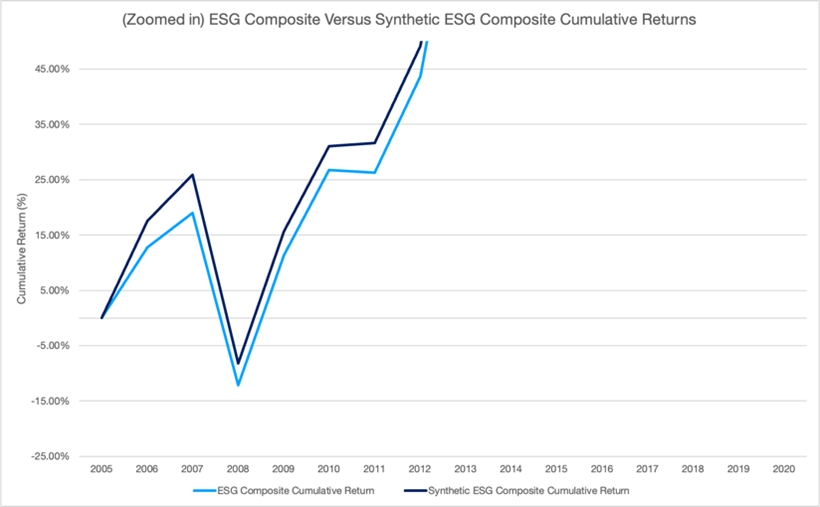
Figure 6. (Zoomed in) ESG Composite vs. Synthetic ESG Composite Cumulative Return
The synthetic ESG Composite slightly outperforms the ESG Composite’s actual cumulative returns for the entire period, particularly between 2005 and 2012, with an approximately 6% improvement in 2007 and an approximately 5% improvement in 2010.
Figure 7 below shows calendar-time returns of a synthetic portfolio of the PRBLX portfolio that uses the factor loadings as estimated from factor regression analysis.
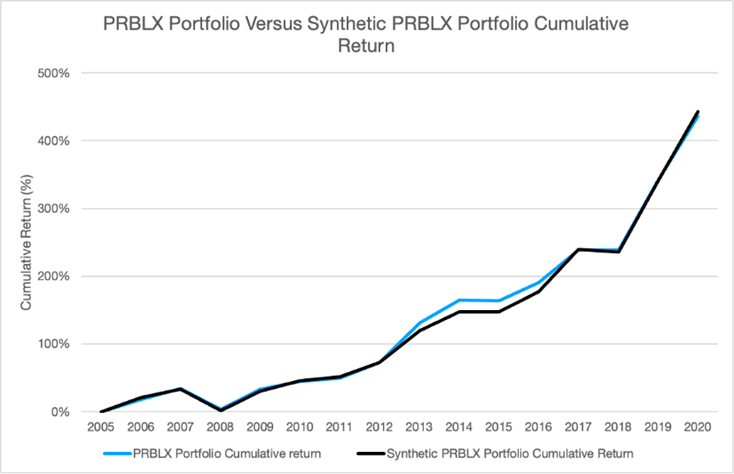
Figure 7. PRBLX Portfolio vs. Synthetic PRBLX Portfolio Cumulative Returns
The synthetic ESG Composite slightly underperforms the PRBLX portfolios actual cumulative returns for the entire period, particularly between 2005 and 2015, with an approximately 10% decrease in 2013 and an approximately 15% decrease in 2015.
V. Interpretation
A. ESG Composite
Due to statistically insignificant differences in cumulative return and annualized return, it can be assumed that the ESG Composite produces approximately equal returns as the S&P 500. This is further proven in figure 1, as there is little deviation between cumulative returns at any point in the period of analysis. In a worst-case scenario, the ESG Composite minimally underperforms, as active return and information ratio are only slightly negative. Ultimately, it can be concluded that both U.S. public equity ESG funds and the S&P 500 will produce a return of approximately 10% per year. On the other hand, volatility of the ESG Composite is significantly less than the S&P 500, as shown by the lower standard deviation and downside deviation. The S&P 500’s particularly high downside deviation implies that, compared to U.S. public equity ESG funds, investing in the S&P 500 produces much greater risk of negative returns. Lower volatility combined with equal returns means the ESG Composite produces greater risk-adjusted returns. This is supported by the fact that Sharpe ratio and Sortino ratio of the ESG Composite are higher than the S&P 500. The ESG Composite’s particularly high Sortino ratio implies that, compared to the S&P 500, investing in U.S. public equity ESG funds produces much greater risk-adjusted returns.
Figure 3 shows the ESG Composite in the higher ranges of annualized Sharpe ratio and annualized returns of the global mutual fund universe. This implies that U.S. public equity ESG funds generally outperform mutual funds from both a returns and risk-adjusted returns basis. Annualized alphas of the ESG composite are average compared to the mutual fund universe, indicating that U.S. public equity ESG funds offer just as much outperformance over the market as the average mutual fund. Supplementing average to above-average returns with exceptional risk-adjusted returns implies that U.S. public equity ESG funds offer much more stability than their mutual fund competitors.
As described in the introduction, the primary reason for ESG bans in the U.S. is the concern of less returns. This analysis dissuades such sentiment by proving that U.S. public equity ESG funds produce greater risk-adjusted returns than the market itself.
Factor analysis of the ESG Composite find statistically insignificant alphas across all equations, suggesting that U.S. public equity ESG funds do not deviate much in returns from the S&P 500. Across all specifications, the results demonstrate slight leverage (investing in the market portfolio), with traditional leverage factor betas near 1, especially in the Asness-Frazzini-Pedersen equation. This is supported by the relatively low tracking error of the ESG Composite, along with figure 1. In the Frazzini-Pedersen equation, the study finds that the ESG Composite has more exposure to large caps given the negative SMB factor. When including the Frazzini and Pedersen (2014) Betting-Against-Beta factor and the Asness et al. (2013) Quality Minus Junk (QMJ) factor, this study finds further evidence that the ESG Composite tilts toward large cap stocks and stocks with high beta exposure.
B. PRBLX Portfolio
With significant differences in cumulative return and annualized return, it can be assumed that the PRBLX portfolio produces much greater returns than the S&P 500. This is further proven in figure 2, as the PRBLX portfolio begins deviating from the S&P 500 in 2007 and continues through 2020. Both active return and information ratio are positive as well, indicating that the PRBLX portfolio minimally outperforms in a worst-case scenario. Ultimately, it can be concluded that the PRBLX portfolio will produce greater returns than the S&P 500’s return of approximately 10% per year. Still, volatility of the PRBLX portfolio is significantly less than the S&P 500, as shown by the lower standard and downside deviations. The drastic difference between downside deviations of the PRBLX portfolio and the S&P 500 implies that, compared to the Parnassus Core Equity Fund, investing in the S&P 500 produces much greater risk of negative returns. Lower volatility combined with greater returns means the PRBLX portfolio produces exceptionally greater risk-adjusted returns. This is supported by the fact that Sharpe ratio and Sortino ratio are much larger than the S&P 500. The PRBLX portfolio’s Sortino ratio is over double the S&P 500, implying that investing in the Parnassus Core Equity fund produces significantly greater risk-adjusted returns than the S&P 500.
Figure 4 shows the PRBLX portfolio in the highest ranges of annualized Sharpe ratio, annualized returns, and annualized alphas of the global mutual fund universe. This implies that U.S. public equity significantly outperform mutual funds from a returns and risk-adjusted basis, as well as exceed mutual funds in their own outperformance over the market. Information ratio of the PRBLX portfolio is near average but still positive, indicating the PRBLX portfolio provides at least as much outperformance as the S&P 500.
All of these results dissuade anti-ESG sentiment in the U.S. spurred by concern over returns by proving that the PRBLX ESG fund produces significantly greater returns and risk-adjusted returns than the market and the global mutual fund universe. Furthermore, it offers specific investment insights that adopting holdings strategies of the PRBLX portfolio can offer the greatest financial benefits of ESG investing.
Factor analysis of the PRBLX portfolio find statistically significant alphas in the CAPM, Carhart, and Frazzini-Pedersen equations of around 2.66%. This implies that the PRBLX portfolio produces expected outperformance over the S&P 500 of at least 2%. Compared to the ESG Composite, traditional leverage factor betas for the PRBLX portfolio are lower, indicating the Parnassus Core Equity fund is less levered to the market than most U.S. public equity ESG funds. On the other hand, SMB value in the same specification is nearly twice as negative the ESG Composite, indicating the Parnassus Core Equity Fund has a much greater preference for large caps than most U.S. public equity ESG funds. Furthermore, BAB factor betas are more negative than the ESG Composite, indicating the Parnassus Core Equity fund has a greater preference for high beta stocks than most U.S. public equity ESG funds.
C. Investment Insights
The composite of U.S. public equity ESG funds produced greater risk-adjusted returns than the S&P 500, with slight underleverage to the market, yet a preference for large cap, high beta stocks. However, there is potential for optimization if these preferences are strengthened. Such improvement is shown in the synthetic portfolio construction of the ESG Composite (figure 6), which used factor loadings from ESG Composite regression to create 5-6% greater returns in certain years. A real-life example of this optimization is such through the Parnassus Core Equity Fund, which maximized such outperformance over the S&P 500 with a more pronounced underleverage to the market, and a stronger preference for large cap and high beta stocks. Synthetic portfolio construction of the Parnassus Core Equity Fund shows that it cannot be optimized any further, as the factor-derived model produced 10-15% worse returns than the actual portfolio in certain years.
As a result, it can be concluded that the most valuable returns in ESG investing come from prioritizing established, high cash flow companies that outperform during periods of economic growth and are stable during contractions. Holdings data of the Parnassus Core Equity Fund support such insight, with companies like Microsoft, Apple, and Alphabet of the largest selections.
Conclusion
The models and procedures from the study of 70 U.S. public equity ESG funds and the isolated Parnassus Core Equity ESG Fund provide conclusive empirical evidence that U.S.-based public equity ESG funds produce greater risk-adjusted returns than the market. This counters anti-ESG sentiment claiming U.S. ESG funds produce worse financial returns and builds upon former analysis finding a positive correlation between CSR and financial performance. Factor analysis reveals that preference for large-cap, high-beta stocks that outperform during periods of economic expansion will produce the greatest financial returns in the U.S. public equity ESG space, as shown by analysis of the Parnassus Core Equity Fund. This means investing into blue chip, high cash flow companies like Microsoft, Apple, and Alphabet will produce the greatest financial returns while balancing ESG criteria.
The shortcomings of this study extend to data collection procedures and testing methodology. Although the U.S. SIF provides a significant portion of U.S. public equity ESG funds, an analysis of all funds in the space would provide a more accurate representation of the relationship between US public equity ESG funds and the S&P 500. However, creating such a dataset would require significant effort to analyze individual firms’ investment processes. Furthermore, most of the tests in factor regression produced statistically insignificant results, which were ignored. Advanced regression analyses would reduce this insignificance, allowing more insights to be drawn.
VII. Appendix
A. Cumulative Return
A cumulative return on an investment is the aggregate amount that the investment has gained or lost over time, independent of the amount of time involved. The cumulative return is expressed as a percentage, and it is the raw mathematical return of the following calculation:
(A1)
$$\frac{\left(Current\ Price\ of\ Security\right)-(Original\ Price\ of\ Security)}{Original\ Price\ of\ Security}$$
Cumulative returns in this study were derived from annual total returns.
B. Annualized Return
An annualized total return is the geometric average amount of money earned by an investment each year over a given time period. The annualized return formula is calculated as a geometric average to show what an investor would earn over a period of time if the annual return was compounded.
Annualized returns in this study were derived from annual total returns, and calculated using Microsoft Excel.
C. Standard Deviation
Standard deviation is a statistic that measures the dispersion of a dataset relative to its mean and is calculated as the square root of the variance. The standard deviation is calculated as the square root of variance by determining each data point’s deviation relative to the mean. Standard deviations in this study were derived from annual total returns.
D. Downside Deviation
Downside deviation is a measure of downside risk that focuses on returns that fall below a minimum threshold or minimum acceptable return (MAR). It is used in the calculation of the Sortino ratio, a measure of risk-adjusted return. Downside deviations in this study were derived from annual total returns.
E. Sharpe Ratio
The Sharpe ratio compares the return of an investment with its risk. It’s a mathematical expression of the insight that excess returns over a period of time may signify more volatility and risk, rather than investing skill. Formula:
(A2)
$$\frac{R_p-R_f}{\sigma_p}$$
where Rp = return of portfolio, Rf = risk-free rate, and σp = standard deviation of portfolio.
Sharpe ratios in this study were derived from annual total returns and the annualized cumulative return of the rolling 3-month T-bill rate.
F. Annualized Cumulative Return of the Rolling 3-Month T-Bill Rate
Rolling 3-month T-bill rates for each year from 2005 to 2020 were provided by MarketWatch, linked here: https://www.marketwatch.com/investing/bond/tmubmusd03m/download-data?countrycode=bx&mod=mw_quote_tab.
The annualized cumulative return of the rolling 3-month T-bill rate in this study was derived from rolling 3-month T-bill rates.
G. Sortino Ratio
The Sortino ratio is a variation of the Sharpe ratio that differentiates harmful volatility from total overall volatility by using the asset’s standard deviation of negative portfolio returns—downside deviation—instead of the total standard deviation of portfolio returns. The Sortino ratio takes an asset or portfolio’s return and subtracts the risk-free rate, and then divides that amount by the asset’s downside deviation. Formula:
(A3)
$$\frac{R_p-R_f}{\sigma_d}$$
where Rp = return of portfolio, Rf = risk-free rate, and σd = downside deviation of portfolio.
Sortino ratios in this study were derived from annual total returns and the annualized cumulative return of the rolling 3-month T-bill rate.
H. Active Return
Active return is the percentage gain or loss of an investment relative to the investment’s benchmark. Active returns in this study were derived from annualized returns.
I. Tracking Error
Tracking error is the divergence between the price behavior of a position or a portfolio and the price behavior of a benchmark. Tracking error is reported as a standard deviation percentage difference, which reports the difference between the return an investor receives and that of the benchmark they were attempting to imitate. Tracking errors in this study were derived from standard deviations.
J. Information Ratio
The information ratio (IR) is a measurement of portfolio returns beyond the returns of a benchmark, usually an index, compared to the volatility of those returns. Formula:
(A4)
$$\frac{(Portfolio\ Return)-(Benchmark\ Return)}{Tracking\ Error}$$
Information ratios in this study were derived from annualized returns and standard deviations.
VIII. References
Allouche, J., & Laroche, P. A meta-analytical investigation of the relationship between corporate social and financial performance. Revue de gestion des ressources humaines, (57), 18, 2005.
Armstrong, A.. Ethics and ESG. Australasian Accounting, Business and Finance Journal, 14(3), 6-17, 2020.
Asness, C., & Frazzini, A. The devil in HML’s details. The Journal of Portfolio Management, 39(4), 49-68, 2013.
Asness, C., Frazzini, A. The devil in HML’s details: factors, monthly [Data set]. AQR Capital Management. https://www.aqr.com/Insights/Datasets/The-Devil-in-HMLs-Details-Factors-Monthly, 2022.
Asness, C., Frazzini, A., Pedersen, L.Quality minus junk: factors, monthly [Data set]. AQR Capital Management. https://www.aqr.com/Insights/Datasets/Quality-Minus-Junk-Factors-Monthly, 2022.
Aupperle, K. E., Carroll, A. B., & Hatfield, J. D. An empirical examination of the relationship between corporate social responsibility and profitability. Academy of management Journal, 28(2), 446-463, 1985.
Ben Brik, A., Rettab, B., & Mellahi, K. Market orientation, corporate social responsibility, and business performance. Journal of Business Ethics, 99(3), 307-324, 2011.
Bowman, E. H. Strategy, annual reports, and alchemy. California management review, 20(3), 64-71, 1978.
Brammer, S., Brooks, C., & Pavelin, S. Corporate social performance and stock returns: UK evidence from disaggregate measures. Financial management, 35(3), 97-116, 2006.
Carhart, M. M. On persistence in mutual fund performance. The Journal of finance, 52(1), 57-82, 1997.
Cornell, B., & Shapiro, A. C. Corporate stakeholders and corporate finance. Financial management, 5-14, 1987.
Download TMUBMUSD03M Data: U.S. 3 month Treasury Bill Price data. MarketWatch. (n.d.). Retrieved January 9, 2023, from https://www.marketwatch.com/investing/bond/tmubmusd03m/download-data?countrycode=bx&mod=mw_quote_tab
Garriga, E., & Melé, D. Corporate social responsibility theories: Mapping the territory. Journal of business ethics, 53(1), 51-71, 2004.
Fama, E. F., & French, K. R. Common risk factors in the returns on stocks and bonds. Journal of financial economics, 33(1), 3-56, 1993.
Fombrun, C., & Shanley, M. What’s in a name? Reputation building and corporate strategy. Academy of management Journal, 33(2), 233-258, 1990.
Frazzini, A., & Pedersen, L. H. Betting against beta. Journal of financial economics, 111(1), 1-25, 2014.
Freedman, A. (2022, August 25). Texas bans BlackRock, UBS, others over ESG investing. Axios. (August 2022) : https://www.axios.com/2022/08/25/texas-bans-blackrock-ubs-esg-backlash
Freedman, M., & Jaggi, B. Pollution performance of firms from pulp and paper industries. Environmental Management, 10(3), 359-365, 1986.
Friede, G., Busch, T., & Bassen, A. ESG and financial performance: Aggregated evidence from more than 2000 empirical studies. Journal of Sustainable Finance & Investment, 5(4), 210-233, 2015: https://doi.org/10.1080/20430795.2015.1118917
Friedman, M. theoretical framework for monetary analysis. journal of Political Economy, 78(2), 193-238, 1970.
Frooman, J. Socially irresponsible and illegal behavior and shareholder wealth: A meta-analysis of event studies. Business & society, 36(3), 221-249, 1997.
Godfrey, P. C., Merrill, C. B., & Hansen, J. M. The relationship between corporate social responsibility and shareholder value: An empirical test of the risk management hypothesis. Strategic management journal, 30(4), 425-445, 2009.
Griffin, J. J., & Mahon, J. F. The corporate social performance and corporate financial performance debate: Twenty-five years of incomparable research. Business & society, 36(1), 5-31, 1997.
Hart, S. L., & Christensen, C. M. The great leap: Driving innovation from the base of the pyramid. MIT Sloan management review, 44(1), 51, 2002.
Hebb, T., Hawley, J. P., Hoepner, A. G., Neher, A. L., & Wood, D. (Eds.). The Routledge handbook of responsible investment. Oxon: Routledge, 2016.
Jain, P., Vyas, V., & Roy, A. Exploring the mediating role of intellectual capital and competitive advantage on the relation between CSR and financial performance in SMEs. Social Responsibility Journal, 2017.
Kurapatskie, B., & Darnall, N. Which corporate sustainability activities are associated with greater financial payoffs?. Business strategy and the environment, 22(1), 49-61, 2013.
Leone, S. US Funds dataset from Yahoo Finance. [Data set]. Kaggle. 2021: https://www.kaggle.com/datasets/stefanoleone992/mutual-funds-and-etfs
Lev, H. ESG funds set a new record inflow by doubling in 2021. ConserviceESG. (2021 May): https://www.gobyinc.com/esg-funds-new-record-inflow-2021/
Margolis, J. D., & Walsh, J. P. Misery loves companies: Rethinking social initiatives by business. Administrative science quarterly, 48(2), 268-305, 2003.
McAbee, J. What is Stakeholder Theory?. Wrike. (2021 June) : https://www.wrike.com/blog/understanding-stakeholder-theory/
McGuire, J. B., Schneeweis, T., & Branch, B. Perceptions of firm quality: A cause or result of firm performance. Journal of management, 16(1), 167-180, 1990.
McGuire, J. B., Sundgren, A., & Schneeweis, T. Corporate social responsibility and firm financial performance. Academy of management Journal, 31(4), 854-872, 1988.
McWilliams, A., & Siegel, D. Corporate social responsibility: A theory of the firm perspective. Academy of management review, 26(1), 117-127, 2001.
Michelon, G., Boesso, G., & Kumar, K. Examining the link between strategic corporate social responsibility and company performance: An analysis of the best corporate citizens. Corporate social responsibility and environmental management, 20(2), 81-94, 2013.
Mishra, S., & Suar, D. Does corporate social responsibility influence firm performance of Indian companies?. Journal of business ethics, 95(4), 571-601, 2010.
Murray, K. B., & Montanari, J. B. Strategic management of the socially responsible firm: Integrating management and marketing theory. Academy of management review, 11(4), 815-827, 1986.
Naylor Association Management Software. Naylor Association management software. The Forum for Sustainable and Responsible Investment. Retrieved January 9, 2023, (n.d.) : https://www.ussif.org/about
Orlitzky, M., Schmidt, F. L., & Rynes, S. L. Corporate social and financial performance: A meta-analysis. Organization studies, 24(3), 403-441, 2003.
Posner, B. Z., & Schmidt, W. H. Values and the American manager: An update updated. California Management Review, 34(3), 80-94, 1992.
Preston, L. E., & O’bannon, D. P. The corporate social-financial performance relationship: A typology and analysis. Business & Society, 36(4), 419-429, 1997.
Roman, R. M., Hayibor, S., & Agle, B. R. The relationship between social and financial performance: Repainting a portrait. Business & society, 38(1), 109-125, 1999.
Ruf, B. M., Muralidhar, K., Brown, R. M., Janney, J. J., & Paul, K. An empirical investigation of the relationship between change in corporate social performance and financial performance: A stakeholder theory perspective. Journal of business ethics, 32(2), 143-156, 2001.
Seifert, B., Morris, S. A., & Bartkus, B. R. Having, giving, and getting: Slack resources, corporate philanthropy, and firm financial performance. Business & society, 43(2), 135-161, 2004.
S&P 500. (2020), S&P 500 (^GSPC) [Data Set]. YahooFinance, https://finance.yahoo.com/quote/%5EGSPC/history?p=%5EGSPC
Spectrum News Staff. Gov. DeSantis takes aim at ‘woke corporations’. Spectrum News. (2022, July 27) : https://www.baynews9.com/fl/tampa/news/2022/07/27/speaking-in-tampa–gov–desantis-takes-aim-at–woke-corporations-
Tang, Z., Hull, C. E., & Rothenberg, S. How corporate social responsibility engagement strategy moderates the CSR–financial performance relationship. Journal of management Studies, 49(7), 1274-1303, 2012.
Van Beurden, P., & Gössling, T. The worth of values–a literature review on the relation between corporate social and financial performance. Journal of business ethics, 82(2), 407-424, 2008.
Van der Laan, G., Van Ees, H., & Van Witteloostuijn, A. Corporate social and financial performance: An extended stakeholder theory, and empirical test with accounting measures. Journal of Business Ethics, 79(3), 299-310, 2008.
Waddock, S. A., & Graves, S. B. The corporate social performance–financial performance link. Strategic management journal, 18(4), 303-319, 1997.
Whelan, T., Atz, U., & Clark, C, 2022. ESG and financial performance: Uncovering the Relationship by Aggregating Evidence from 1,000 Plus Studies Published between 2015–2020. NYU, ESG and Performance.
Yahoo! Finance.). Parnassus Core Equity Fund – Investor Shares (PRBLX) Stock Price, News, Quote & History – Yahoo Finance. (2022, May 25) : https://finance.yahoo.com/quote/PRBLX?p=PRBLX