Volume 34, Issue 1: Paper 3
Profit Shares and Cost-Push Inflation: Examining the Distributional Nature of U.S. Inflation and the Effectiveness of Monetary Policy
The focus of this paper examines the question: Are profits driving inflation in the post-pandemic economic recovery? Starting in 2021, the U.S. experienced a sharp increase in inflation to levels unseen for the first time in forty years. The deceleration of inflation without a substantial increase in unemployment challenges the effectiveness of monetary tightening and the view that excessive aggregate demand is the culprit for accelerating price growth. Hence, it is important to examine the novel features of post-pandemic inflation (2021-22) as effective policy tools likely override the capabilities of monetary policy. The application of monetary policy is blunt and indiscriminate, aggravating existing inequality amongst economic agents. Therefore, effective inflation targeting should seek to prohibit predatory pricing behavior that propagates cost shocks onto real wages.
The theoretical foundations of the paper build upon the sellers’ inflation framework, a term coined by Lerner (1958) and developed further in the context of the post-pandemic inflationary episode by Weber and Wasner (2023). They demonstrate that large firms operating in highly concentrated sectors can protect profit margins against rising input costs through temporary monopoly power granted by supply chain bottlenecks. Additionally, using POLS regression analysis on panel data over three distinct periods, Matamoros (2023) finds the aggregate markup rate and the level of capacity utilization correlate with higher rates of annual CPI inflation for six industrialized countries in 2022. For the U.S., Castro-Vincenzi and Kleinman (2022) highlight the implications of rising import costs on the labor share in output. They find that higher import costs correspond with declining U.S. labor share beginning during the 2000s commodities boom. Lastly, Nikiforos et al. (2024) empirically exhibit how real wages bear any cost of a foreign-determined price shock. They show that the mere maintenance of markups in the nonfinancial corporate sector implies a redistribution of income against wages.
The aim of this paper is to investigate the extent to which increasing profit share affects the behavior of inflation and the institutional conditions that determine the distribution of output to profits and wages. To do so, I examine the cyclical fluctuations of profit share, focusing on periods following an exogenous shock (Figure 1). I compare the behavior of profit share relative to the rate of CPI inflation and the level of capacity utilization for the two major oil crises of the 1970s with the onset of COVID-19 (Figure 3, 4). Building upon my theoretical argument, Figure 2 illustrates the gradual weakening of the bargaining power of labor. More specifically, the number of in-effect work stoppages declines from 1981-23 while the share of profit in output increases. To measure the effects of rising profit share on inflation, I conduct three Ordinary Least Squares (OLS) regressions based on my econometric model in equation (3). I then analyze the OLS estimates based on the theoretical foundations of this paper to demonstrate the possibility of profit-led inflation empirically. Accordingly, Figure 5 illustrates the implications of rising profit share on the corresponding rate of quarterly CPI inflation.
The contributions of this work establish the explanatory power of rising profit share on accelerating inflation during the post-pandemic economic recovery. I construct my OLS regressions based on a post-Keynesian markup pricing equation similar to that of Lavoie (2023). While much of the recent literature examines both aggregate and sectoral markups to explain inflationary pressures following the 2020 recession, the interpretability of profit share is confined to theoretical arguments based on the cyclical fluctuations in macroeconomic indicators of price stability. Therefore, my econometric model is similar to the POLS regression from Matamoros (2023). However, this paper uses profit share as a proxy for markups to analyze the new inflationary paradigm and the change in income distribution. The share of profit in output highlights how firms set their prices relative to the institutional conditions in an economy. In contrast, markups are a good indicator of sectoral price-setting behavior.[1] Furthermore, I test for the effectiveness of monetary policy by including the effective federal funds rate in my third OLS regression. Overall, the theoretical and empirical foundations of this paper provide an alternative macroeconomic perspective on post-pandemic inflationary pressures.
The results of this paper convey the importance of appropriate policy measures when inflation is cost-push and profit-led. Table 2 shows that the rising share of profit in output corresponds with accelerating CPI inflation. Additionally, the absence of cyclical fluctuations in profit share during the 2020 recession demonstrates that large firms operating in the nonfinancial corporate business sector passed on rising input costs to real wages. Figure 3 illustrates that the share of profit in output increased even when capacity utilization was at historic lows. The weakened position of labor in wage-setting challenges the likelihood of persistent inflation absent any other exogenous shocks. Thus, rising profit share correlates with transitory inflation as firms capitalize on enhanced monopoly power in the face of rising input costs and supply-side constraints. With that in mind, contractionary monetary policy operates on a counterfactual basis to its intended result. Specifically, Table 2 demonstrates that increasing the target rate corresponds with accelerating CPI inflation.
In Section I, I provide a more in-depth analysis of the relevant literature to elucidate the foundations of my theoretical argument in the following sections. Section II discusses the data and methodological basis of my econometric model and empirical analysis. Additionally, Table 1 provides an overview of the variables in my econometric model. My summary statistics show that the mean rate of CPI and level of capacity utilization are 3.5% and 80%, respectively. In Section III, I lay out the theoretical model in equations (1) and (2) based on the post-Keynesian markup pricing equation. Furthermore, I provide my empirical model in equation (3) and follow up with a discussion based on the results of my OLS regressions in Table 2. I also address the reliability and interpretative capabilities of my model, addressing instances of serial correlation in Table 4. Section IV compares the results of my econometric analysis to the extent that they demonstrate the existence of cost-push and profit-led inflation. The discussion focuses on the importance of social and institutional factors that induce predatory pricing behavior, as outlined by Weber and Wasner (2023). I wrap up the paper with a comprehensive discussion of the relevant limitations, policy implications, and opportunities for future research. Section V provides a list of the relevant figures referenced throughout the paper.
I. Literature Review
I.A. Profit-led Inflation
The literature concerning profit-led inflation, like sellers’ inflation, examines the causes of inflation concerning firm price-setting behavior. They do so by building upon the conceptual framework developed by Weber and Wasner (2023). Accordingly, their paper brought attention to a discordant view with the conventional wisdom of monetary policy. More recently, prominent central bankers have acknowledged the new inflationary paradigm, particularly the European Central Bank (ECB). Despite recognizing the unconventional nature of inflation, the Fed did not attempt to reconcile policy measures with inflation outside the limited scope of monetary restraint. Some of the more recent literature aims to measure the effectiveness of monetary policy outside the traditional theory of cost-push inflation. With decelerating inflation beginning in late 2022, new data can strengthen the profit-led inflation hypothesis by evaluating recent monetary tightening and the long-run effects of “inflation first” policies. The current economic environment marks a watershed moment that will determine the economic health of the U.S. economy over the next five years and beyond. The contributions of supply chain shocks to inflation are well documented by firms, central banks, and academics alike; the shift in consumer demand exacerbated the sharp rise in the price level alongside the deficient supply of those goods due to myriad factors. Conditions of imperfect competition and competing interests of capital and labor in the share of national output provide the theoretical foundations of profit-led inflation. The term “profit-led” highlights the distributional nature of inflation alongside the increasing share of profits in output. Joan Robinson (1953) adroitly observes that prices are one of the myriad variables that drive competition; they function in unison to limit competition and create imperfect competition. The sellers’ inflation framework resembles the Kaleckian view of price-setting behavior where prices are reinforced by a tacit agreement; a firm’s price will influence appreciably the average price of other firms so that price formation is a factor of the average price (Kalecki, 1971). Accordingly, a more general post-Keynesian approach draws on the work of Kalecki and Robinson and is further reinforced by Institutionalists such as John Galbraith. Examining the various macroeconomic variables proposed in the recent literature can strengthen the theoretical basis of profit-led inflation through empirical analysis. In line with the focus of this paper, it also demonstrates the extent to which profitability played a role in post-pandemic inflation.
I.B. Cost-push Inflation
Cost-push inflation is a supply-side phenomenon originating from increased production costs such as raw materials. The cost-push inflation in the post-pandemic period originated from commodity price shocks and supply chain bottlenecks in significant upstream sectors. The conceptual framework developed by Weber and Wasner (2023) demonstrates the coordinating mechanisms for price hikes in four stages, beginning with a period of sustained stability. The competing view of post-pandemic inflation relies on a marginalist approach that excludes the price-setting behavior of firms. From this perspective, inflation expectations and ensuing demand-led pressures cause accelerating price-level growth. Sellers’ inflation demonstrates that sector-wide cost shocks motivate firms to protect profit margins through a tacit agreement to raise prices. Even as prices stabilize and costs decline, profit margins are maintained or increased. This behavior is captured by the surge of profit share in output following the initial COVID-19 supply shock (Figure 1). Hence, firms can pass on the cost of inputs as an exercise of market power, and the increase in profit share illustrates the distribution of income against real wages. The perennial conflict of sellers’ inflation culminates in a wage-price spiral, where the labor market responds to price increases derived from firms with market power in critical sectors maintaining profit margins. The labor market seeks to reconcile losses in real wages and, if successful in doing so, propagate another round of price increases from firms seeking to protect profit margins further (Weber & Wasner, 2023). However, the absence of strong labor market institutions makes the wage-price spiral an unlikely characteristic of post-pandemic inflation. The firms in these critical sectors are price makers, except in the case of commodities, and will only increase prices if competitors are expected to do the same (Weber & Wasner, 2023; Kaldor 1985, p. 22). While they are not market clearing, prices of commodities demonstrate competitive dynamics; the market determines the price. Thus, price leaders determine the price of commodities; price takers will imitate the pricing behavior of the leader (Lavoie, 2006). Due to the nature of the temporary monopoly power granted to these firms, demand is less elastic and makes pricing more conducive when cost shocks occur. Firms pursue a price over volume strategy and do so regardless of demand; they unilaterally raise prices, and consumers react in the conflict stage.
From a neoclassical perspective, market share and profits play no role in inflation. Inflation is a matter of an overheated labor market with output above its natural level; hence, inflated wages and low unemployment are driving inflation. Notably, the underlying dynamics of demand-pull inflation are set against the backdrop of falling unemployment with a proximate rise in bargaining power and gains in the real wage, more generally, the rising labor share of income (Bivens, 2022). Workers demand higher wages, leading to a potential wage-price spiral. In past economic recoveries, profit margins fell as more corporate income went increasingly to the labor share of income. Unemployment during previous recessions was high, and demand growth stagnated, leading to decreased bargaining power. This decrease in bargaining power due to falling demand dampened wage growth and increases in the price level. However, the present economic recovery exhibits a declining labor share of income and the real wage tangentially with falling unemployment (Bivens 2022). Growing unit costs in the nonfinancial corporate (NFC) sector attribute the rise in corporate profits and nonlabor inputs to a profit-price spiral. Labor is no longer the supply side issue but rather shipping capacity and other non-labor shortages (Bivens, 2022). From 1979-2019, corporate profits contributed to 11.4% of the increase in unit costs in the NFC sector. Remarkably, beginning in the second quarter of 2020 to the fourth quarter of 2021, corporate profits contributed to 53.9% of the increase in unit prices (Bivens, 2022). Other notable increases included a drastic shift in the contributions of unit labor costs, which was 7.9% in the second quarter of 2020 to the fourth quarter of 2021; between 1979 and 2019, 61.8% of the increase is attributable to unit labor costs (Bivens, 2022).
Shapiro et al. (2024) examine the effects of monetary tightening on measures of financial stress when inflation is either supply- or demand-driven. Their findings indicate that monetary tightening induces high levels of financial stress when inflation is supply-driven. Though such conclusions coincide broadly with the post-Keynesian emphasis placed on the adequacy of monetary policy for responding to certain economic shocks, their focus is nonetheless out of scope for the focus of this paper.
The Kansas City Fed noted that corporate profits contributed to inflation in 2021 but found no contribution in 2022 (Glover et al., 2023). There is a notable pattern in previous economic recoveries that inflation and corporate profits are consistent with price-setting behavior for firms expecting higher costs of production. The fundamental uncertainty firms face is the crux of post-Keynesian literature regarding the theory of the firm; the long-run position of an economy is not independent of the short-run. The future is non-ergodic (path-dependent) and firms make decisions that will alter future dynamics; there are likely multiple equilibrium positions in an economic recovery (Lavoie, 2006). The post-Keynesian concept of historical and dynamic time, emphasizing the latter, is foundational to the theoretical sellers’ inflation framework. The final equilibrium position of an economy is perpetually in flux as it transitions from one short-run position to another. How firms respond to economic shocks in the short run is crucial to understanding the relationship between price-setting and persistent inflation.
The heterodox literature documents the critical role of corporate profits in contributing to inflationary pressure from 2021-2022. The cost-push origins of post-pandemic inflation extend the vulnerability of price stability to future exogenous shocks, such as the pandemic, that can propagate and amplify price increases when firms seek to protect profit margins.[2] The sellers’ inflation theory shows that transitory inflationary pressures can become self-sustaining in the face of further economic shocks. Contractionary monetary policy may be less effective in future instances of sellers’ induced inflation as its remedies seek to alleviate demand-driven pressures from the labor market in the conflict stage, which Weber and Wasner (2023) argue, is too late in their theoretical framework.
I.C. Markup Inflation
Much of the literature on cost-push and profit-led inflation focuses on the propagation of price hikes stemming from commodity price shocks. Alternative views of post-pandemic inflation, including sellers’ inflation, examine how firms respond to realized and expected upward pressure on production costs. The microeconomic impulses for hiking prices are the basis of analysis in more recent literature, where firms raise prices according to the pricing strategies of other firms operating in the same sector (Weber & Wasner, 2023). One way to measure a firm’s capture of market power is the markup rate. When the markup rate far exceeds an increase in the costs of production granted by temporary monopoly power, relative prices are distorted. More generally, the extent to which a firm can set prices above marginal costs is an exercise of its market power. Economists from disparate ideological camps have recently taken an interest in the macroeconomic implications of markups and the degree to which they denote market power.
In their seminal paper, De Loecker et al. (2020) show that aggregate markups began increasing in 1980 and rose from 21% to 61% in 2016. Interestingly, they found that a few high-markup firms were responsible for such a drastic increase. Comparatively, firms in the median realized stable increases in their markup. De Loecker et al. (2020) additionally measure an increase in overhead costs from the same period from 1% to 8%. They continue that the aggregate markup rate increase is more than proportionate to the increase in overhead. Hence, overhead costs are not a strong contributor to the rise in the aggregate markup rate. They additionally measure an increase in firm profitability corresponding to rising aggregate markups and conclude that the market power of firms has increased over the period.
On the contrary, San Francisco Fed economist James Traina (2018) found that aggregate markup rates stagnated and declined between 1980 and 2018 after accounting for the rising share of marketing and management costs in firm production. In the manufacturing sector, he finds that changes in price markups are attributable to technological innovation, not market concentration. However, the paper’s results do not address the recent surge of profit share in output, nor the role of rising import costs and the decline of U.S. labor share, as shown by Castro-Vincenzi and Kleinman (2022).
The post-Keynesian theory of price formation is based on the Kaleckian markup pricing model, where prices depend on unit direct costs (Lavoie, 2006). It demonstrates the importance of costs in price-setting when there is imperfect competition, and firms operate in highly concentrated markets. The interdependence of firms in a particular industry underscores the importance of price-setting for an individual firm’s long-term strategy. Logically, it follows from the post-Keynesian view that firms are price-setters. On the other hand, all firms are price-takers according to the neoclassical assumption that prices adjust to equilibrate supply and demand in the market. The short-run maximization of profits occurs in a competitive environment where marginal costs are equal to the market price, and profit accrues when prices are above a firm’s average total cost (Lavoie, 2006). In a general sense, prices are determined by demand in the neoclassical model. Conversely, firms in oligopolistic sectors set their prices as a markup over normal unit costs, and prices are cost-determined. It follows from the post-Keynesian theory that prices are subject to economics without equilibrium, where prices are not set to equalize supply and demand (Kaldor, 1985; Lavoie, 2006). The marginalist view of price-setting is akin to the neoclassical theory that firm markups are set by a measure of marginal cost.
Nikiforos et al. (2024) use the “accounting” method to calculate firm markups, citing empirical evidence that firms set their prices over a measure of average cost. Interestingly, they found results “highly correlated” with De Loecker et al. (2020), who take a marginalist approach to obtain their estimated markups. Thus, regardless of whether firms applied markups over a marginal cost or an average total cost, there was a notable increase in the U.S. aggregate markup rates. Nikiforos et al. (2024) extend their analysis of markups to the pandemic and the ensuing inflation beginning in 2021. Although beyond the scope of this paper, they decompose sectoral changes in markups from 2019-2022 using Compustat data and find a drastic increase in markups, especially in critical upstream sectors.
Additionally, they use annual data from Compustat to calculate the aggregate markup rate from 1962-2022. Using the same sample as De Loecker et al. (2020), they construct estimates excluding the financial sector, foreign private issuers, and both. Although excluding financial firms and foreign issuers is the more appropriate measure of markups, all four yield a significant increase beginning in 1980 (Nikiforos et al., 2024). Systemically important sectors, such as mining, realized a 25.63% increase in markups from 2019 to 2022, in line with the theoretical understanding of markup pricing stemming from an exogenous shock. For the sake of this paper, the role of markups cannot be understated as a mechanism of income distribution between profits and wages. In aggregate, the mere maintenance of markups and rising profit share further demonstrate that post-pandemic inflation was a distributional phenomenon.
I.D. Capacity Utilization
The measurement of capacity utilization is another insightful indicator of price-setting behavior, showing the relationship of prices to unit costs at varying levels of production. It is an important gauge of a firm’s interplay with supply and demand and how they administer those prices accordingly. Essentially, one can discern the stages of business cycles via the variability in capacity utilization. The proportion of capacity used in an economy to that which is available is the level of so-called “slack.” A firm adjusts its level of production according to the level of demand and its potential to satisfy future demand. The U.S. measurement of capacity utilization, the Total Capacity Utilization (TCU) index, is calculated and published by the Board of Governors of the Federal Reserve System to capture sustainable maximum output for 89 industries (Federal Reserve Board, 2023). Each industry’s seasonally adjusted level of output is divided by a respective capacity index. Lower capacity utilization rates indicate increasing unit costs, demonstrating an economic recession. Historically, lower rates of capacity utilization correspond with lower inflation except for the recessionary period between 1973 and 1975. Matamoros (2023) exhibits the importance of accounting for capacity utilization concerning post-pandemic inflationary pressures. Across six industrialized countries, including the U.S., the capacity utilization coefficient is positive and significant in his POLS regression; a one percentage point increase in capacity utilization corresponds with a 0.1 percentage point increase in CPI inflation. Controlling for capacity utilization yields a positive and significant relationship regardless of using the FIBER or CRB index for measuring unit material costs. While Matamoros (2023) extrapolates annual OECD data to measure capacity utilization, the scope of my research pertains to U.S. inflation and will utilize monthly data from the TCU index.
The conventional view of inflation, relative to markups and capacity utilization, is that firms operating at full capacity are merely responding to supply constraints in the market. Firms can set higher markups as a response to inflation due to the degree of market concentration. Simply put, it is the fact that firms in systemically significant upstream sectors are price takers and, from that, derive their pricing behavior. Economists of conventional wisdom, such as Larry Summers, remain ardent skeptics of the idea that institutional factors underlie the distribution of market power and price-setting. On the contrary, heterodox views of imperfect competition suggests a firm’s ability to fix prices is an expression of market power; markups are independent of capacity utilization until reaching full employment (Matamoros, 2023).
Further, the fundamental uncertainty of the market explains the preference of firms to produce with excess capacity. This uncertainty causes firms to operate below practical capacity even as unit costs are decreasing; increasing the production of an existing plant can attenuate a volatile shift in consumer demand. Direct costs are fixed up to full capacity and equal to marginal cost; indirect costs (overhead costs) comprise a firm’s variable costs. The average total cost of a unit is thus the sum of the unit overhead cost and unit direct cost, which decreases up to full capacity (Lavoie, 2006). To adapt to the changing conditions of demand, firms can opt to increase inventories. However, intermittent demand shocks limit the use of inventory; a firm can only respond to a shock once without increasing its practical capacity. Both overtime work and the employment of higher wages can alleviate higher-than-expected demand. Consequently, this will bring a firm’s production beyond its practical capacity; the long-run effects will be costly with the breakdown of machines and slower production (Lavoie, 2006). Thus, the level of capacity utilization is integral to understanding how firms set their prices and the ensuing macroeconomic implications, in particular, the nature of accelerating inflation. The relationship between profit share and the level of capacity utilization demonstrates firm price-setting power after the initial COVID-19 shock.
I.E. The Bargaining Power of Labor
The recent economic recovery, beginning with accelerating inflation in early 2021, is extraordinary in the sense that unemployment remained low with decelerating inflation. The literature attributes this new paradigm, in part, to the bargaining power of labor. Further examination of profit shares and markups unveils a weakening in the bargaining power of labor, implicating the theory of a wage-price spiral. Due to fixed costs, profit shares indeed increase at the onset of a business cycle, as Lavoie (2023) and Bivens (2022) point out. However, markups and profit share rose in the U.S. when capacity utilization, employment rate, and price-to-earnings (P/E) ratios were below pre-pandemic levels. In other words, profit shares and markups typically fall with the rise of unemployment, low capacity utilization, and low P/E ratios. Therefore, the increase in profit shares as a result of fixed costs is not adequate to discredit profit-led inflation.
The share of labor and wages in national output began its precipitous decline in the 1970s. The literature on industrial and labor relations in the U.S. documents that increasing levels of inequality are consistent with the fall in labor share over the last forty years. The decline in the relative price of investment goods provides one explanation for the downward trend of labor share in the U.S. (Dao et al., 2017). Therefore, firms now employ more capital over labor in production. Another factor contributing to the decline of the labor share is the weakening of institutional factors in wage-setting. How the labor share of income relates to inflation relies upon its distributional effects, which gives rise to competing claims to output between labor and capital. Applying the logic of the Institutionalist/Kaleckian theory of inflation, the erosion of bargaining power in the labor market contests the success of monetary policy as the reason for long-term price stability before the pandemic. Conflicting claims to national output are the basis of Kalecki’s inflation theory (Seccareccia & Matamoros, 2022). Simply, inflation results from class conflict between agents or sectors competing for a larger share of real income. Likewise, institutional and social dynamics determine the distribution of income and markups. If institutional factors are strong (e.g., labor unions), then labor can maintain its real wage through increasing nominal wages. Empirical evidence shows the flattening of the short-run Phillips curve, which is the conventional indicator of inflationary pressures corresponding to the level of unemployment. Beginning in the 1960s, inflation became increasingly unresponsive to low unemployment rates; there is a large flat range on the Phillips curve between the theoretical target unemployment rate and full employment (Lavoie, 2006). There are multiple equilibria at which inflation can be managed, and the Fed should target policies that promote full employment. Additionally, a target rate, which is currently 2%, is inappropriate if inflation is no longer responsive to conventional macroeconomic indicators of price stability. Thus, contractionary monetary policy can exacerbate inequality by promoting unnecessarily high levels of unemployment.
The neoclassical theory presupposes that supply and demand determine income and markups; institutional factors are restricted under the role of supply and demand (Nikiforos et al., 2024). Profit-led inflation does not require an increase in markups, as previously understood. A firm’s ability to maintain its markup is commensurate with the distributional nature of post-pandemic inflationary pressures; real wages bore the cost shocks to critical upstream sectors through price increases. The weakened position of labor challenges the possibility of conflict inflation; high unemployment and a decrease in the output gap no longer correspond to declining inflation. In the face of persistent inflation, there is an underlying mechanism that perpetuates it. Accordingly, the post-Keynesian literature uses Kalecki’s theory of competing interests to show the distributional origins of inflation as such a mechanism. Weber and Wasner (2023) define the underlying force in their work as the propagation and amplification stage of sellers’ induced inflation, drawing on the theoretical foundations of Kalecki and the post-Keynesians. Therefore, the conflict stage is a consequence of inflation, not a cause of it. Additionally, the weak bargaining power of labor in wage-setting is unlikely to set off a wage-price spiral.
II. Data and Methodology
II.A. U.S. Inflation Data
Data for the U.S. inflation come from the Bureau of Labor Statistics (BLS) through two monthly surveys: the commodities and services survey collect 94,000 prices per month, and the housing survey collects 8,000 rental housing unit quotes (BLS, 2023). The two surveys are aggregated into the Consumer Price Index (CPI). Through March and April of 1980, CPI inflation peaked at 14.6%. Additionally, high levels of inflation have not exceeded 10% since 1981 eluding to a structural shift in the economy, in particular, how wages respond to prices during periods of economic recovery. Although inflation in the recent economic recovery reached 9%, pre-pandemic inflation was strikingly low and stable. Relative to the Personal Consumption Expenditure Price Index (PCE), which sources data from businesses, CPI data comes from consumers; the CPI gauges the distributional nature of inflation and is more relevant for measuring the effects of firm market power and pricing behavior. CPI inflation increased in 2021 and continued to accelerate in 2022, demonstrating the downstream effects on consumer prices from cost shocks in systemically important sectors.
For U.S. capacity utilization data, my demand variable, I use the Federal Reserve’s Total Index (TCU), which includes capacity indexes for 89 industries across 3 major sectors: 71 in manufacturing, 16 in mining, and 2 in electric and gas utilities. The U.S. Geological Survey and the Department of Energy’s Information Administration report capacity data in physical units for several industries. Additional data measured in physical units for some industries are available through trade sources (paper, motor vehicles, petroleum refining, etc.), accounting for 26% of the total industrial capacity. In the absence of physical product data, the Fed indexes industrial capacity based on the Quarterly Survey of Plant Capacity (QSPC) from the Bureau of the Census, representing 64% of total industrial capacity. A few mining industries are calculated based on peaks through trends in production, denoting the remaining 10% of total industry capacity (Federal Reserve Board, 2023). According to Matamoros (2023), capacity utilization and effective demand may respond inversely to growing markups that lower the real wage. I account for capacity utilization relative to profit share to elucidate the distributional developments of inflation.
This paper considers the effects of monetary policy on inflation from 2021-22 by using the effective federal funds rate (EFFR). The Federal Open Market Committee (FOMC) determines a target rate that influences the EFFR via open market operations and the buying and selling of government bonds. Recent policy measures to tame inflation relied on the faculties of open market operations to restrict excess liquidity and slow economic activity. Notably, the Fed enacted contractionary monetary policy in line with its dual mandate, achieving price stability and full employment. Monetary policy is effective under the pretense that inflation is a response to an overheated labor market driving a wage-price spiral — inflation is demand-driven. However, I hypothesize inflation to be a distributional phenomenon. Accordingly, monetary policy is inappropriate when the bargaining power of labor is weak, and excessive austerity measures have long-term implications on economic welfare. Controlling for monetary policy in my model, I will test the effectiveness of inflation targeting by the Fed.
Data for the U.S. labor market also comes from the BLS. The Current Population Survey (CPS) is a monthly survey of 60,000 eligible households that provides comprehensive data on the U.S. labor force. I use data covering all 50 states, including the District of Columbia, to measure the unemployment rate for wage and salary workers across all sectors between 1967 and 2023. The unemployment rate is defined as the number of unemployed persons as a percent of the labor force (BLS, 2024). Additionally, the BLS provides other valuable labor market data, including the rate of union membership and work stoppages. The union membership rate is defined as the proportion of all wage and salary workers who are union members (BLS, 2024). In 1973, 24% of all wage and salary workers were union members. Only 10% of all wage and salary workers were union members in 2023 (Hirsch et al., 2024). Measurements of work stoppages in the U.S. are beginning and in-effect for a given period. As with the rate of union membership, the number of in-effect work stoppages emphasizes the relative bargaining power workers can leverage in wage-setting negotiations. The 1980s saw the onset of a drastic decline in the frequency of in-effect work stoppages, while profit share gradually increased through the 1990s and 2000s (Figure 2). That being the case, the gradual decline in work stoppages and union membership empirically demonstrates the changing structure of labor market institutions and wage-setting dynamics over time.
The data for U.S. profit share come from the National Income and Product Accounts (NIPA) published by the Bureau of Economic Analysis (BEA). NIPA produces aggregate national income data under the Domestic Product and Income section, providing detailed measures of the value and composition of national output (BEA, 2023). Using data from the nonfinancial corporate business (NFCB) sector, I calculate profit share as the proportion of after-tax profits in gross value added without inventory valuation adjustments (IVA) and capital consumption adjustments (CCadj). IVA and CCadj adjust profit estimations relative to changes in the prices of inventories and the replacement costs of capital stocks due to inflation (Weber & Wasner, 2023). Figure 1 illustrates the sharp increase in U.S. profit share following the initial COVID-19 shutdown. Henceforth, the profit share falls with decelerating inflation in 2022 but remains historically high compared to pre-pandemic levels.
II.B. The flattening of the Phillips Curve
The weakened bargaining power of labor suggests that a wage-price spiral is an unlikely phenomenon and becomes foundational for instances of cost-push and profit-led inflation. Thus, many post-Keynesian economists point to the flattening of the Phillips Curve as evidence not only for the weakened bargaining power of labor but also the effectiveness of monetary policy. Although examining the Phillips Curve is not the focus of this paper, the changing dynamics of inflation and unemployment in the U.S. are emblematic of the new inflationary paradigm. According to Matamoros (2023), the flattening of the Phillips Curve means those at the lower end of the income distribution are disproportionately affected by high-interest rates and unemployment. The implications of a flattening Phillips Curve suggest the weakening of labor market institutions’ ability to bargain for higher wages. Accordingly, inflation is no longer responsive to falling aggregate demand. While demand and the level of employment can contribute to inflationary pressures, the flattening Phillips Curve suggests inflation is likely the result of structural changes in the economy. Such structural changes amplify the distributional effects of inflation, which is also shown in the decline in union membership and labor share (rising profit share).
The conflict inflation theory put forth by neoclassical and new Keynesian economists, as well as prominent central bankers, seem counterfactual to empirical observations of diminished labor market institutions. Furthermore, the flattening of the Phillips Curve qualitatively supports that inflation targeting is no longer responsive to low unemployment. Therefore, I argue that the decline in both work stoppages and the rate of union membership refutes the conflict inflation theory. The lack of robust institutional factors in the labor market weakens the ability of wages to put pressure on prices.
II.C. Profit Share as a Proxy for Markups
The aggregate profit share allows one to discern the distributional implications of inflation relative to firms price-setting behaviors. Structural changes to the U.S. economy underlie the relative behavior of profit share over time. The observed rise in the profit share is indicative of a decline in the bargaining power of labor over time. According to Colonna et al. (2023), the profit share can increase even when markups remain constant. This can occur when material input costs grow faster than labor costs, a similar observation made by Matamoros (2023). Some criticisms regarding the use of profit share as a proxy for measuring markup inflation follow that the observed increase in profit share is a result of cyclical factors (Glover et al., 2023; Lavoie, 2023). If this is the case, fixed costs cause total unit costs to decrease during an economic recovery. As firms set their prices over an average total cost up to full capacity utilization, the profit share will increase.
Both Lavoie (2023) and Colonna et al. (2023) make a good point regarding the price-setting behavior of firms and the role of business cycles in increasing aggregate profit shares. However, they do not explain the unusual behavior of U.S. profit share during the 2020 recession. Generally, the profit share emphasizes the distributional sources of inflation for two main reasons. The fact that firms can maintain their markups implies that real wages bear exogenous cost shocks to inputs in production. The theory of profit-led inflation shows that constant markups are thus indicative of a significant redistribution of income against real wages (Nikiforos et al., 2024). Second, unlike previous cycles noted by Glover et al. (2023), the 2020 recession preceding inflation in 2021 did not realize a significant decline in profit share (Figure 1). In fact, the labor share increased in Q2 of 2020 before declining again in 2021. This is likely due to the large fiscal stimulus package enacted during the onset of the pandemic. When institutional factors are strong, a decrease in the rate of unemployment allows workers to claim higher wages — business cycles experience a cyclical profit squeeze at high levels of employment (Nikiforos et al., 2024). At low levels of unemployment in the business cycle, labor can no longer increase its share in output.
Profit-led inflation can occur even when markups are constant due to the distributional nature of inflation. Therefore, the profit share is an appropriate proxy for the aggregate markup rate. I expect the profit share to be a major contributor to CPI inflation during the economic recovery following the pandemic-era recession in Q2 of 2020. To further analyze the historical contributions of profit share to inflation, I will measure the period from 1967 to 2023 while controlling for the federal funds rate and the unemployment rate. Additionally, I will create an interaction term to examine the historical contributions of profit share to inflation in the years following the pandemic. Weak institutional factors in the labor market allow profits to maintain their position in output and thus should increase or remain constant even when inflation is high. What’s more, the profit share should increase further with decelerating inflation as the economy recovers due to the existence of fixed costs, as Lavoie (2023) points out.
III. Framework and Analysis
III.A. Theory
The basis for analyzing and understanding the new inflationary paradigm warrants the examination of certain parametric shifts in the contemporary U.S. economy. The macroeconomic dimensions of post-pandemic inflation result from institutional changes that determine the role of firms’ profits and price-setting behavior. As such, the explanatory faculties of a purely marginalist approach negate the role of exogenous (non-economic) factors that determine the underlying causes of inflation. These exogenous factors include the power of unions in wage-setting, the role of fiscal and monetary policy, and the relative degree of monopoly power in a sector. Simply put, higher costs and prices are not determined by aggregate demand; rather, they depend on the relative strength of exogenous factors. Therefore, aggregate demand-driven inflation is not a natural phenomenon of cyclical fluctuations in a capitalist economy.
Building on the ‘sellers’ inflation’ framework developed by Weber and Wasner (2023), I further analyze the downstream effects of exogenous cost shocks on the price level. To develop my empirical framework, I find the post-Keynesian markup pricing equation provides the theoretical foundations for my econometric model:
(1) $$p=(1+m)(ULC+UMC)$$
Assuming that imports are used as material inputs in the cost of production, represented by the variable UMC, prices (p) are set as a markup over unit cost (ULC+UMC), where the markup is represented by m in equation (1). Furthermore, ULC constitutes the relationship between a measure of labor productivity and nominal wages (Nikiforos et al., 2024). This approach to aggregate price-setting behavior demonstrates the relative price stability over the business cycle noted in the sellers’ inflation framework. The period of economic recovery after a recession realizes a proportionally larger increase in labor productivity compared to the increase in employment. Thus, the growth in wages will be less than proportional to the growth in the price level.
The ratio of unit import costs to unit labor costs yields an aggregate pricing model that can be arranged to measure the correspondence between the profit share and the markup:
(2) $$πs=\frac{m(1+\frac{UMC}{ULC})}{(1+m(1+\frac{UMC}{ULC})}$$
While an increase in the markup leads to an increase in the profit share, the profit share can increase even when markups are held constant. Equation (2) shows that an increase in the cost of imports relative to unit labor cost increases the profit share without a change in the markup.[3] For the U.S., Castro-Vincenzi and Kleinman (2022) find that an increase in the price of imports corresponds to a decline in the labor share. Therefore, the distributional effects of price-setting behavior become clearer. Both Lavoie (2023) and Colonna et al. (2023) make the point that the 2021-22 inflationary episode cannot be characterized as ‘profit-led’ due to the cyclical nature of profits. While this is historically the case in past cycles, it does not address the novel dynamics of profit shares demonstrated by Nikiforos et al. (2024) and Bivens (2022). More precisely, the onset of the 2020 recession did not realize a significant decline in profit shares relative to output.
III.B. Methodology
Insofar as markups are merely maintained with an increase in the price of imported material inputs, real wages fall as an economy recovers. Thus, it becomes crucial to examine the dynamics of cyclical fluctuations and profit shares over time to explicate the distributional implications of U.S. inflation. Table 1 provides all the estimated variables:
Table 1: Descriptive Statistics
| Variable | Obs. | Mean | Std. Dev. | Min | Max |
|---|---|---|---|---|---|
| CPI | 304 | 3.536 | 2.887 | -2.8 | 14.4 |
| AR (1) | 303 | 3.537 | 2.892 | -2.8 | 14.4 |
| AR (2) | 302 | 3.537 | 2.897 | -2.8 | 14.4 |
| Capacity Utilization | 228 | 80.078 | 4.173 | 66.729 | 88.52 |
| Unemployment Rate | 304 | 5.705 | 1.702 | 2.567 | 13 |
| Federal Funds Rate | 278 | 4.602 | 3.575 | .06 | 17.78 |
| Profit Share | 304 | 9.078 | 2.882 | 2.379 | 17.467 |
| Intercept 1973-74 | 762 | .009 | .095 | 0 | 1 |
| Profit Share 1973-74 | 304 | .217 | 1.418 | 0 | 10.38 |
| Intercept 1979-80 | 762 | .009 | .095 | 0 | 1 |
| Profit Share 1979-80 | 304 | .224 | 1.469 | 0 | 10.869 |
| Intercept 2021-22 | 762 | .009 | .095 | 0 | 1 |
| Profit Share 2021-22 | 304 | .363 | 2.374 | 0 | 17.467 |
Equation (3) represents my econometric model:
(3) $$CPI_t=β_0+ϕ_1 (CPI_{(t-1)})+ϕ_2 (CPI_{(t-2)})+β_1(capacity)_t+β_2(unemp)_t+β_3(fedfunds)_t+β_4(πs)_t+β_5(I_{1973-74})_t + β_6(πs_{1973-74})_t)+β_7(I_{1979-80})_t + β_8(πs_{1979-80})_t + β_9 (I_{2021-22})_t +β_10 (πs_{2021-22})_t + ε_t$$
Using macroeconomic time-series data, I estimate the effects of profit shares and capacity utilization over time. To account for autocorrelation in the CPI data, I use two autoregressive components in my linear regression. In other words, I estimate the effects of capacity utilization and the share of profits in output on the rate of inflation while controlling for two lagged values of CPI. The autoregressive process provides reliable estimates of my population regression coefficients. The coefficient ϕ1 estimates the effect of a lagged change in inflation one period back. Similarly, the coefficient ϕ2 estimates the effect of a lagged change in inflation two periods back. Additionally, the inclusion of AR(1) and AR(2) components addresses second-degree serial correlation, a key indicator of model interpretability in time-series data.
The level of capacity utilization is accounted for by using the variable capacity at time t. The level of capacity utilization is a key macroeconomic indicator in that it corresponds to the level of aggregate demand and is a good measure of fluctuations in the business cycle. Accordingly, there is a significant fall in capacity utilization during the 1980s crisis and the 2008-09 recession (Matamoros, 2023). Following the pandemic, capacity utilization returned to its historic average, though absent cyclical fluctuations in profitability (Table 1).
The model seeks to infer the changing dynamics of inflation as a result of structural changes to the economy, examining three historical periods, including 1973-74, 1979-80, and 2021-2022. The periods beginning in 1973 and 1979 constitute the first and second OPEC oil shocks, respectively. Both periods predate the onset of the Great Moderation and posit accelerating inflation following exogenous shocks to the price of imports. Accordingly, the periods from 1973-74 and 2021-22 depict accelerating price inflation, low levels of unemployment, and stagnating nominal wage growth (Matamoros, 2023). Including multiple historical periods provides a comprehensive basis for examining the structural and institutional determinants of accelerating inflation — particularly the changing distribution of profits and wages over time. Hence, the share of profits in output () is modeled at time t according to the corresponding historical period. The variable I denotes the intercept of the respective period and interacts with profit share at time t to estimate the corresponding slope coefficient.
The faculties of aggregate demand policies depend on a tradeoff between the level of unemployment and controlling inflation. In line with the post-Keynesian inflation model proposed by Atesoglu (1997), the rate of unemployment is a key indicator of long-run inflation and price stability. The coefficient for the variable at time t provides the estimated impact of an increase in the rate of unemployment on the rate of inflation from 1967 until the last quarter of 2023.
To measure the effectiveness of monetary policy on the rate of inflation, I include an additional variable modeled at time t. My use of a policy variable derives from the post-Keynesian theory of markup inflation to assess the appropriateness of monetary policy during the post-pandemic economic recovery.
III.C. Results
Table 2 presents the results of the OLS estimates obtained from my empirical model. Both autoregressive components are statistically significant, but while the AR(1) component is positively correlated with the present rate of inflation, the AR(2) component indicates a smaller, negative correlation.
Table 2: OLS Estimates for the U.S. Consumer Price Index (CPI)
| Dependent Variable | (1) CPI Inflation |
(2) CPI Inflation |
(3) CPI Inflation |
|---|---|---|---|
| AR(1) | 1.05*** (.084) |
1.04*** (.083) |
1.024*** (.081) |
| AR(2) | -.177** (.077) |
-.18** (.074) |
-.223*** (.064) |
| Capacity | .055*** (.015) |
.072*** (.017) |
.052*** (.016) |
| Profit Share | .018 (.015) |
.022 (.015) |
.048** (.019) |
| Intercept 1973-74 | -.804 (1.645) |
-1.102 (1.743) |
-1.193 (2.265) |
| Profit Share 1973-74 | .211 (.179) |
.241 (.188) |
.244 (.238) |
| Intercept 1979-80 | -2.257 (2.488) |
-2.007 (2.476) |
-1.517 (2.13) |
| Profit Share 1979-80 | .366 (.243) |
.343 (.241) |
.289 (.206) |
| Intercept 2021-22 | -9.592*** (3.514) |
-8.668** (3.494) |
-7.285** (3.466) |
| Profit Share 2021-22 | .662*** (.225) |
.611*** (.222) |
.533** (.217) |
| Unemployment | .06 (.037) |
.045 (.034) |
|
| Federal Funds Rate | .07** (.027) |
||
| Constant | -4.121*** (1.301) |
-5.864*** (1.529) |
-4.468*** (1.356) |
| Observations | 228 | 228 | 228 |
| R-squared | .954 | .954 | .957 |
Robust standard errors are in parentheses
*** p<.01, ** p<.05, * p<.1
The also model suggests a strong, positive correlation between the level of capacity utilization and the rate of inflation. In particular, a one percentage point increase in the level of capacity utilization is commensurate with a 0.05-0.06 percentage point increase in the quarterly inflation rate. Even though the corresponding relationship with the level of capacity utilization is strong and positive, it is small in magnitude. Comparable with the findings of Matamoros (2023), the level of annual capacity utilization in six industrialized countries is both significant and positively correlated with the rate of CPI inflation; a one percentage point increase in the level of capacity utilization implies a 0.08 percentage point increase in the rate of inflation. Interestingly, both models estimate very small and positive correlations.
Upon further examination, the profit share coefficient — the effect of profit share on inflation from the first quarter of 1967 to the fourth quarter of 2023 — is positive but statistically insignificant. Similarly, both periods preceding the Great Moderation signify no significant relationship with the level of inflation. Conversely, the share of profits in output during the post-pandemic economic recovery exhibits a strong positive correlation with quarterly CPI inflation. More specifically, a one percentage point increase in the profit share corresponds with a 0.6-0.7 percentage point increase in the rate of inflation. Using the FIBER commodity price index for six industrialized countries, Matamoros (2023) finds a strong, positive correlation between the aggregate markup rate and annual CPI inflation. For the year 2022, a one percentage point increase in the aggregate markup rate coincides with a 2.2 percentage point increase in the rate of inflation. The similar strength and magnitude of the aggregate markup rate and the profit share in output corroborates the theoretical interpretation of rising profit shares and inflation posited by Nikiforos et al. (2024). Chiefly, the very maintenance of markups and real profits are borne by real wages when the price of imported inputs rises.
Including unemployment and the federal funds rate further develops the distributional implications of inflation (Table 2). Controlling for the federal funds rate, the second regression indicates no significant relationship between the unemployment rate and inflation. Modeling inflation with the rate of unemployment reveals the level of capacity utilization and the share of profits in output from 2021-22 remain positively correlated with the rate of inflation. A one percentage point increase in profit share from 2021-22 is associated with a 0.6 percentage point increase in the rate of inflation. Additionally, a one percentage point increase in capacity utilization correlates with a 0.07 percentage point increase in the inflation rate. While the original model controls for unemployment and the federal funds rate, the additional empirical models retain the statistical and explanatory significance of the recent surge in profit shares and the level of capacity utilization.
The estimates obtained from adding an exogenous policy variable — the federal funds rate — empirically test the effectiveness of monetary policy for controlling inflation (Table 2). Even with the inclusion of two additional model parameters, the profit share in output from 2021-22 is positively correlated with the rate of inflation. The partial effect of a one percentage point increase in profit share from 2021-22 is a 0.5-0.6 percentage point increase in the inflation rate. To further demonstrate the outcome, Figure 5 shows accelerating inflation corresponding with the increasing share of profits in output. Additionally, the level of capacity utilization remains a significant indicator for higher rates of inflation. Unlike the two previous regressions, the profit share from 1967-23 is significant at the 5% level. Thus, a one percentage point increase in profit share correlates with a 0.04-0.05 percentage point increase in the rate of inflation. Although this increase is small, the model estimates the impact of profit share on quarterly inflation. Hence, the rising share of profits in output indicates long-term implications for the inflation rate beyond exogenous supply shocks.
Regarding the effectiveness of monetary policy, the estimated relationship between the federal funds rate and inflation is small but positive at a 5% level of significance. This indicates that the current regime for controlling inflation may be counterfactual to the intended objectives of monetary policy. Accordingly, a one percentage point increase in the benchmark policy rate correlates with a 0.07 percentage point increase in the rate of inflation.[4] Such a relationship corresponds with the theory of cost-push inflation, where inflationary pressures arise from exogenous factors.
III.D. Robustness Checks
To ensure sound inference capabilities from the model in equation (3), I apply the proper robustness measures to address serial correlation. The consequences of serial correlation are more acute in time-series data, requiring that observations of the error term are independent of one another. Due to the presence of higher-order autoregressive components, the Breusch-Godfrey test provides the appropriate procedure for detecting serial correlation.
Table 4 tests the null hypothesis of no serial correlation following a chi-squared distribution with one degrees-of-freedom.
Table 4: Breusch-Godfrey LM Test for Autocorrelation (1 Lag)
| Model Reliability | (1) CPI |
(2) CPI |
(3) CPI |
|---|---|---|---|
| Chi2 | 2.278 | 1.536 | 1.428 |
| Degrees of Freedom | 1 | 1 | 1 |
| Prob > Chi2* | 0.131 | 0.2152 | 0.2321 |
* H0: no serial correlation
The results for each of the three models indicate no presence of serial correlation. However, including a first-order autocorrelation component in Table 2, represented by the coefficient ϕ1 in equation (3), yields an unstable trajectory. More specifically, because ϕ1>1, the model lacks stationarity and is likely dependent on higher-order autocorrelation components.
Table 5 tests the null hypothesis of no serial correlation following a chi-squared distribution with two degrees-of-freedom.
Table 5: Breusch-Godfrey LM Test for Autocorrelation (2 Lags)
| Model Reliability | (1) CPI |
(2) CPI |
(3) CPI |
|---|---|---|---|
| Chi2 | 2.289 | 1.679 | 1.382 |
| Degrees of Freedom | 2 | 2 | 2 |
| Prob > Chi2* | 0.318 | 0.4319 | 0.5011 |
* H0: no serial correlation
Accordingly, each of the three regressions exhibits no presence of serial correlation. The lack of stationarity in the first-order autocorrelation coefficient warranted the inclusion of an additional autoregressive component in Table 2, represented by the coefficient ϕ2 in equation (3). The incorporation of a second-order autoregressive component met the following parameter value constraints for interpretability across the three models: (1) that -1<ϕ2<1, and (2) ϕ1± ϕ2<1.
In accordance with the proper robustness measures, the empirical model illustrated in equation (3) produces reliable OLS estimates in Table 2. Thus, including two autoregressive components accounts for higher-order serial correlation and ensures stationarity. Additionally, I conduct an F-test for the level of joint significance between the three historical periods of profit share and the rate of inflation. Table 3 demonstrates that the level of profit share jointly explains the variance in the rate of CPI inflation.
Table 3: F-Test for Joint Significance
(1) Profit Share 1973-74 = 0
(2) Profit Share 1979-80 = 0
(3) Profit Share 2021-22 = 0
F(3, 217) = 3.18
Prob > F = 0.0249
IV. Discussion of Results and Conclusion
IV. A. Structural Changes in the U.S. Economy
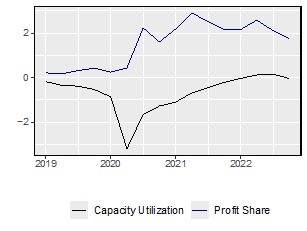
Labor market dynamics are perhaps the most important indicator of the current institutional conditions in U.S. economy. The weakened position of labor in output can be attributed to the gradual decline in the bargaining power of labor, made clear by the historically low rates of union membership and in-effect work stoppages. When coupled with the indiscriminate effects of high-interest rates, workers remain in a defensive position against inflation. The lack of significant results regarding profit share in 1973-74 and 1979-80 demonstrates the institutional conditions of that time (Table 2). As illustrated in Figure 4, workers were able to bargain for wage increases during periods of high inflation preceding the Great Moderation, dampening a firm’s ability to increase its share of profits in output. Conversely, rising inflation in conjunction with a greater share of profits in output corresponds with the absence of strong labor market institutions in the wage-setting process.
The level of capacity utilization in the post-pandemic period appears to behave according to cyclical fluctuations in aggregate demand. As the U.S. economy recovered from supply chain bottlenecks and pandemic-era shutdowns, capacity utilization recovered to its pre-pandemic levels by late 2021. By 2022, inflationary pressures set in, prompting the Fed to raise interest rates. Monetary policy aims to influence aggregate demand through the curtailment of business investment. However, when capacity utilization is high, firms find that profit prospects are favorable. Hence, expanding production capabilities will seem beneficial to firms and, most business investment will remain unresponsive to moderate increases in interest rates (Galbraith, 1998). Historically, a recession resulting from an exogenous shock tends to decrease the level of capacity utilization and profit share (Figure 3). While inflation typically ensues with increasing capacity utilization, robust labor market institutions can control excess profitability. The absence of cyclical fluctuations in profit share during the initial COVID-19 recession in early 2020, jointly with historically low levels of capacity utilization, conveys the novel behavior of post-pandemic inflation.
Just as low levels of unemployment indicate higher inflation, inflationary pressures become acute when capacity utilization is rising beyond a “natural rate.” Accordingly, the quarterly CPI and capacity utilization rates correspond positively with one another, as shown in Table 2. However, high profitability in conjunction with rising capacity utilization in 2021-22 empirically demonstrates that wage increases lag behind rising productivity during the post-pandemic economic recovery, as theorized in equations (1) and (2). More specifically, wage growth is less than proportion to increases in productivity thus prices rise more than wages. On the contrary, this mechanism was absent in the economic recovery following the oil crises in 1973 and 1979, whereas capacity utilization is rising with no significant correspondence between profits and inflation (Figure 3; Table 2). These two periods show that increasing labor productivity corresponds with a higher proportion of the labor share in output (the inverse of profit share). Thus, the threat of a wage-price spiral is a matter of the institutional conditions that determine the distribution of output amongst wages and profits. The 1970s demonstrate the requisite conditions for this inflationary paradigm as worker compensation tracked worker productivity, and high inflation ensued alongside stagnating profit share in output (Figure 4).
IV. B. Conclusion
The presence of limitations in this paper pertain to the accessibility of data for calculating markups, as well as discrepancies in the explanatory power of markups regarding inflation by more mainstream economists. Accessibility to industry and firm-level data is limited to public provisions of indexes from the Federal Reserve and the Bureau of Economic Analysis. For firm-level data, much of the existing literature uses Standard and Poor’s Compustat financial and market information database. The accessibility is thus limited to the cost of the subscription and the lack of institutional access. Regarding industry-level data, the Haver Analytics commodity price indexes are limited in the same capacity. Matamoros (2023) and Weber and Wasner (2023) point to the limitations of an aggregative approach to firm markups due to the variability in market power and the pricing behaviors of different industries.
To address the interpretive variation between the aggregative and sectoral markup rate, I utilize the U.S. profit share to highlight the distributive implications of a cost-push and profit-led inflation. Thus, the paper examines changing inflationary dynamics from a purely macroeconomic perspective. Consequently, the explanatory capabilities of the paper’s empirical contributions are limited to aggregate conditions of the U.S. economy. As a result, price-setting at the sectoral and firm level exhibits heterogenous behavior, with large firms operating in oligopolistic sectors disproportionately contributing to the increasing level of profits in output. While the paper’s results render a source of further comment on the important role of exogenous factors in line with theories of classical political economy, the limitations constrain the scope of interpretability to the contemporary macroeconomic dynamics of U.S. inflation.
The application of monetary policy in times of inflation operates on the presumption of excessive aggregate demand and seeks to equilibrate that demand by controlling investment. Thus, monetary policy excludes the influence of exogenous factors as a component of price-setting behavior. The relative ineffectiveness of monetary policy is a matter of the prevailing structure of the U.S. economy. The effects of monetary policy are felt asymmetrically, and the burden of “tight money” is borne by those most vulnerable to inflationary pressures. On the contrary, large firms operating in oligopolistic sectors can access a reserve of unliquidated gains for investment purposes; hence, firms with a higher degree of market control may contract out from the effect of monetary policy (Galbraith, 1998). Just as weakened institutional factors enable large firms to pass on rising input costs, the same mechanism shifts the onus of higher interest rates to real wages.
As the economy recovered from pandemic-era bottlenecks and commodity price shocks, the Fed imposed contractionary monetary policy aimed at dampening excess aggregate demand. The application of monetary policy is blunt and unpredictable. Weber and Wasner (2023) survey earnings calls from large corporate conglomerates and find they are confident in their ability to weather a recession, echoing the exemption from monetary restraint observed by Galbraith (1998). The conditions of profit-led inflation occur only in an environment of imperfect competition and where institutional factors determine the relative severity of inflation. Thus, the faculties of monetary policy are less than adequate to properly control inflationary pressures. Improving the policy toolkit should include limiting excessive financial speculation in commodity markets. For one, Breman and Storm (2023) show that speculative activity in U.S. crude oil markets was responsible for 24%-28% of the increase in WTI crude price between Q4 2020 and Q2 2022.[5] Additionally, establishing more robust institutional factors can limit predatory pricing behavior granted by cost shocks and bottlenecks. Specifically, measures to improve U.S. price gouging laws can dampen the severity and extent of temporary monopoly power. The effectiveness of commodity buffer stocks also alleviates the pressures of price volatility in the face of a global emergency. In 2022, the Biden administration employed the use of the Strategic Petroleum Reserves, which achieved success in reducing domestic oil prices. The utilization of buffer stocks where demand for essential consumer goods is relatively inelastic can create price stability without the need for explicit price controls.
The bout of inflation exhibited behavior unique to the institutional conditions of the current U.S. economy. As such, effective inflation management should aim to maintain price stability without inducing an unnecessary recession, and policymakers should consider the relevant implications of exogenous factors. Along the lines of the sellers’ inflation framework, policy should seek to arrest inflation during the impulse stage, not merely respond to it and potentially exacerbate the current situation with high interest rates. Additionally, the emphasis on achieving and maintaining the Fed’s 2% inflation target rate remains empirically contested in the face of stagnating real wages and the anchoring of long-run expectations.
The examination of U.S. post-pandemic inflation in the foregoing analysis adds to the growing contributions in the recent literature by examining the role of profit shares in the face of supply-side disruptions and current institutional conditions. Accordingly, future research on profit-led inflation should incorporate available markup data with sectoral profit shares to discern the interplay between the two better. Numerous accounts of sectoral markup heterogeneity emphasize the need for further disaggregation of price-setting behavior at the industry and firm level. Therefore, additional research should focus on different measures of output. A further breakdown of markups and profits could demonstrate how firms operating within a particular sector set prices because of intra-sectoral transactions.[6] By disaggregating sectoral output, the distributional conflict between profits and wages can be extended to include the impact of intermediate inputs in price-setting behavior. How firms within a sector respond to an exogenous shock relative to intra-sectoral differences remains an interesting research question with important social and economic implications.
This paper uses the CPI to model the behavior of post-pandemic inflation, consistent with the analytical frameworks in the relevant literature. However, further examination of other price indexes, such as the Personal Consumption Expenditure (PCE) index, could provide valuable insight for comparison among different measures of inflation. The Fed evaluates inflation on a quarterly basis using the PCE index, making its policy decisions accordingly. Thus, an interesting proposition for future research could examine the behavior of PCE inflation with similar parametric constraints as shown in equation (3). The relative weights used to calculate CPI and PCE inflation which come from different data sources.[7] Accordingly, the examination of different indexes could provide valuable insights for policymaking and developing tools for effective inflation management.
The extent to which profitability impacted U.S. inflation in the post-pandemic economic recovery is ultimately a question of the institutional conditions that facilitate the distribution of output between capital and labor (profits and wages). This paper shows that it is appropriate to characterize post-pandemic inflationary pressures as cost-push and profit-led in the sense that transitory and persistent inflation exist in times of overlapping emergencies. Undue harm to social welfare need not occur if the appropriate policy tools and adjustments are made. The paper’s results demonstrate that the exercise of monetary restraint through high interest rates may exacerbate growing levels of inequality, punishing those more reliant on borrowed funds. Although much more remains to be investigated, the role of exogenous factors in times of persistent inflation cannot be understated.
V. List of Figures
Figure 1: Quarterly U.S. Profit Shares from 1947-23
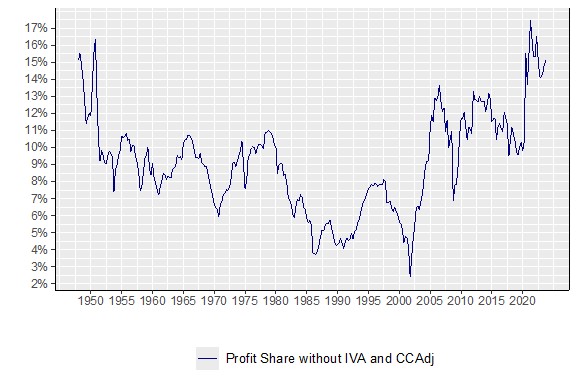
Notes: Profit share in Figure 1 is defined as quarterly after-tax corporate profits as a percentage of gross value added in the non-financial corporate business sector. Inventory valuation adjustments (IVA) and capital adjustments are excluded for the purpose of understanding the impact of corporate profits on inflation. Large firms typically have access to unliquidated gains — including unrealized gains on inventory and depreciation allowances via corporate accounting practices — that change the behavior of profits due to inflationary pressures (Galbraith, 1998; Weber and Wasner, 2023).
Source: BEA
Figure 2: Quarterly U.S. Profit Shares and Work Stoppages from 1981-23
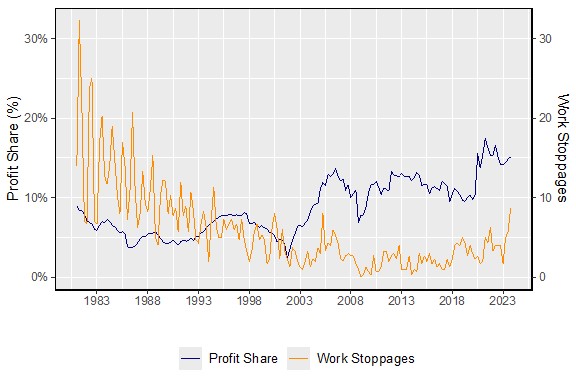
Notes: Work stoppages in Figure 2 is the number of in-effect work stoppages. Profit share is the percentage of profits in gross value added (see Figure 1 notes).
Source: BEA
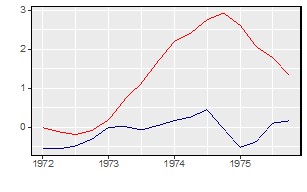
Figure 3: U.S. Capacity Utilization
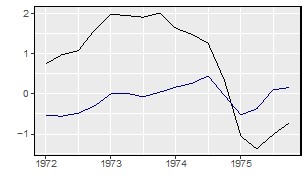
1971-75
2019-22
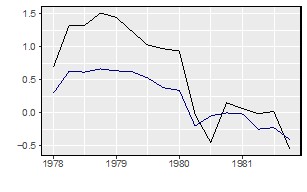
1978-81
Notes: Profit share is calculated without inventory valuation adjustments (IVA) and capital consumption adjustments (CCadj) (see Figure 1 notes). Scale adjustments for interpretability were made for capacity utilization and profit share.
Source: BLS
Figure 4: U.S. Profit Share and Inflation
1972-75
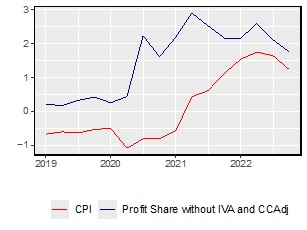
2019-22
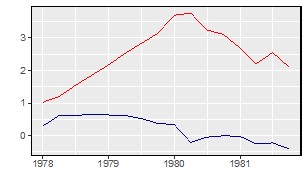
1978-81
Notes: Scale adjustments for interpretability were made for CPI and profit share.
Source: BLS
Figure 5: U.S. Profit Share in the Post-Pandemic Period
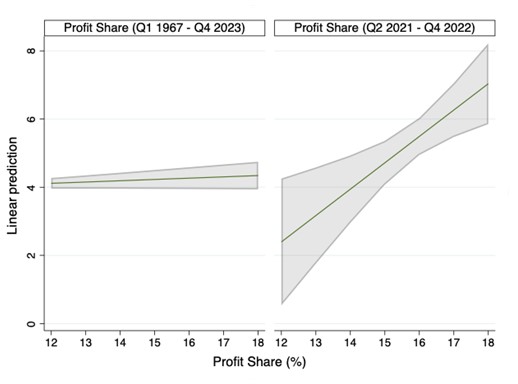
Notes: Profit share ranged from 14-17% from Q2 2021 to Q4 2022. The lowest recorded share of profits in output was 2%, recorded in Q4 2001. Estimates are made with 95% confidence intervals.
Source: BEA
References
Atesoglu, H. Sonmez. 1997. “A Post Keynesian Explanation of U.S. Inflation.” Journal of Post Keynesian Economics. M.E. Sharpe Inc. doi:10.1080/01603477.1997.11490132.
Bivens, Josh. 2022. “Corporate profits have contributed disproportionately to inflation. How should policymakers respond?” Economic Policy Institute. https://www.epi.org/blog/corporate-profits-have-contributed-disproportionately-to-inflation-how-should-policymakers-respond/.
Breman, Carlotta, and Servaas Storm. 2023. “Betting on Black Gold: Oil Speculation and U.S. Inflation (2020–2022).” International Journal of Political Economy 52 (2). Routledge: 153–80. doi:10.1080/08911916.2023.2238565.
Boissay, Frederic, Fabrice Collard, Cristina Manea, and Adam Shapiro. 2024. “Monetary Tightening and Financial Stress during Supply- versus Demand-driven Inflation.” Federal Reserve Bank of San Francisco Working Paper 2023-38. https://doi.org/10.24148/wp2023-38
Castro-Vincenzi, Juanma, and Benny Kleinman. 2022. “Intermediate Input Prices and the Labor Share.” Princeton University, unpublished manuscript. https://www.castrovincenzi.com/research/blog-post-title-two-49acg.
Colonna, Fabrizio, Roberto Torrini, and Eliana Viviano. 2023. “The Profit Share and Firm Markup: How to Interpret Them?” SSRN Electronic Journal. Elsevier BV. doi:10.2139/ssrn.4464310.
Dao, Mai Chi, Mitali Das, Zsoka Koczan, and Weicheng Lian. 2017. “Why Is Labor Receiving a Smaller Share of Global Income? Theory and Empirical Evidence.” IMF Working Papers 17 (169). International Monetary Fund (IMF). doi:10.5089/9781484311042.001.
De Loecker, Jan, Jan Eeckhout, and Gabriel Unger. 2020. “The Rise of Market Power and the Macroeconomic Implications.” Quarterly Journal of Economics. Oxford University Press. doi:10.1093/qje/qjz041.
Federal Reserve Board. 2023. “Capacity Utilization Explanatory Notes.” Industrial Production and Capacity Utilization. https://www.federalreserve.gov/releases/g17/CapNotes.htm.
Galbraith, John Kenneth. The Affluent Society. Boston: Houghton Mifflin Harcourt, 1998.
Glover, Andrew, José Mustre-del-Río, and Alice von Ende-Becker. 2023. “How Much Have Record Corporate Profits Contributed to Recent Inflation?” The Federal Reserve Bank of Kansas City Economic Review, January. Federal Reserve Bank of Kansas City. doi:10.18651/er/v108n1glovermustredelriovonendebecker.
Hirsch, Barry, David Macpherson, and William Even. 2024. Union Membership and Coverage Database. https://unionstats.com/.
Kaldor, Nicholas. Economics without Equilibrium. New York, N.Y.: M.E. Sharpe, 1985.
Kalecki, Michal. Selected Essays on the Dynamics of the Capitalist Economy. Cambridge, U.K.: Cambridge University Press, 1971.
Lavoie, Marc. Introduction to Post-Keynesian Economics. Palgrave Macmillan, 2006.
Lavoie, Marc. 2023. “Some Controversies in the Causes of the Post-Pandemic Inflation.” Monetary Policy Institute Blog. https://medium.com/@monetarypolicyinstitute/some-controversies-in-the-causes-of-the-post-pandemic-inflation-1480a7a08eb7.
Lerner, Abba. 1958. “Inflationary Depression and the Regulation of Administered Prices.” The Relationship of Prices to Economic Stability and Growth: Compendium of Papers Submitted by Panelists Appearing before the Joint Economic Committee, 257-268. Washington, D.C.: Government Printing Office.
Matamoros, Guillermo. 2023. “Are Firm Markups Boosting Inflation? A Post-Keynesian Institutionalist Approach to Markup Inflation in Select Industrialized Countries.” Review of Political Economy. Routledge. doi:10.1080/09538259.2023.2244440.
Nikiforos, Michalis, Simon Grothe, and Jan David Weber. 2024. “Markups, Profit Shares, and Cost-Push-Profit-Led Inflation.” Industrial and Corporate Change 33 (2). Oxford University Press: 342–62. doi:10.1093/icc/dtae003.
Robinson, Joan. 1953. “Imperfect Competition Revisited.” The Economic Journal 63 (251). Oxford University Press (OUP): 579. doi:10.2307/2226447.
Seccareccia, Mario, and Guillermo Matamoros. 2022. “The Fed Tackles Kalecki.” Institute for New Economic Thinking. https://www.ineteconomics.org/perspectives/blog/the-fed-tackles-kalecki.
Traina, James. 2018. “Is Aggregate Market Power Increasing? Production Trends Using Financial Statements.” SSRN Electronic Journal, February. Elsevier BV. doi:10.2139/ssrn.3120849.
U.S. Bureau of Economic Analysis (BEA). 2023. “Concepts, source data, and estimating methods.” Concepts and Methods of the U.S. National Income and Product Accounts. https://www.bea.gov/resources/methodologies/nipa-handbook/pdf/chapters-01-04.pdf.
U.S. Bureau of Labor Statistics. 2023. “Consumer Price Index: Data Sources.” U.S. Bureau of Labor Statistics. https://www.bls.gov/opub/hom/cpi/data.htm.
U.S. Bureau of Labor Statistics. 2017. “Estimating the U.S. Labor Share.” U.S. Bureau of Labor Statistics. https://www.bls.gov/opub/mlr/2017/article/estimating-the-us-labor-share.htm.
U.S. Bureau of Labor Statistics. 2023. “The Importance of Output Choice: Implications for Productivity Measurement.” U.S. Bureau of Labor Statistics. https://www.bls.gov/opub/mlr/2023/article/the-importance-of-output-choice.htm.
U.S. Bureau of Labor Statistics. 2024. “Union Members Technical Note.” U.S. Bureau of Labor Statistics. https://www.bls.gov/news.release/union2.tn.htm.
Weber, Isabella M., and Evan Wasner. 2023. “Sellers’ Inflation, Profits and Conflict: Why Can Large Firms Hike Prices in an Emergency?” Review of Keynesian Economics 11 (2). Edward Elgar Publishing Ltd.: 183–213
[1] Institutional conditions can include laws limiting financial speculation, price gouging, the relative strength of labor market institutions, etc.
[2] Boissay et al. (2024) examine the effects of monetary tightening on measures of financial stress when inflation is either supply- or demand-driven. Their findings indicate that monetary tightening induces high levels of financial stress when inflation is supply-driven. Though such conclusions coincide broadly with the post-Keynesian thesis on adequate policy responses regarding certain economic shocks, their focus is outside of the scope of this paper.
[3] Equations (1) and (2) are the author’s interpretation of the post-Keynesian markup and profit share models by Lavoie (2023).
[4] The Fed uses ‘basis points’ to indicate the level of change in the benchmark policy rate. 100 basis points are the equivalent of one percentage point.
[5] West Texas Intermediate (WTI): the main U.S. oil benchmark and underlying commodity for the New York Mercantile Exchange’s (NYMEX) oil futures contract.
[6] Intra-sectoral transactions are purchases of intermediate inputs produced by other firms within the same sector (BLS, 2023).
[7] The BLS calculates the CPI based on the Consumer Expenditure Survey, while the BEA calculates the PCE index based on various business surveys.