Volume 32, Issue 1: Paper 4
Delayed School Start Time and Graduation Rates” A Nationwide Study
William Gu, Princeton University
The importance of a good night’s sleep has long been established as an essential function of the human body to recharge from a day’s work. For developing teenagers in particular, sleep plays an important role in emotional, social, physical, and mental development by promoting analytical thinking and creativity, reducing irritability and risk of mental health disorders, and regulating hormonal balance, metabolic profile, and impulse behavior (Suni 2021). As such, the Academy of Sleep Medicine recommends approximately 9-12 hours of sleep per night for children ages 6-12 and 8-10 hours for children between the ages of 13-18 (Paruthi et al. 2016).
Given the widespread awareness and extensive research on the importance of sleep on adolescents, sleep deprivation is alarmingly on the rise among youth, particularly among high school students. From 2009 to 2015, the percentage of high school students who reported getting sufficient sleep dropped from 30.9% to 27.3%, and 1 in 5 high school students reported getting less than 6 hours of sleep a night (Wheaton et al. 2018). CDC’s 2019 Youth Risk Behavior Survey indicated that 77.0% of high school students get fewer than 8 hours of sleep on school nights, with the American Academy of Pediatrics going so far as to call it a “national epidemic” (Thompson 2020).
To combat this “national epidemic” of sleep deprivation, a potential solution has grown increasingly controversial in recent years: delaying high school start times. Organizations such as the American Academy of Pediatrics, the American Medical Association, and the American Academy of Sleep Medicine have all previously recommended delaying high school start times (Suni 2021), claiming that doing so increases sleep duration each night. Among other benefits, delaying high school start times have been hypothesized to lead to improved attendance, decreased tardiness, reduced irritability symptoms, and a decline in motor vehicle crashes involving teenage drivers (Danner and Phillips 2018).
However, while delaying high school start times may seem like the perfect antidote to teenage sleep deprivation, doing so may lead to various other consequences, such as decreased time for after-school extra-curricular activities, scheduling conflicts for students whose parents have early morning workdays, as well as an increased reliance on district bussing. Shifting high school start times later may also conflict with primary school start times, especially among school districts who only have one set of buses to be shared between primary and high schools (Morgan 2012). In addition, delayed school start times may not lead to increased sleep duration, but rather, a shift to later sleep schedules. Doing so may cause more harm than good, especially since later sleep times have been shown to lead to unhealthy diets and a less active lifestyle (American Academy of Sleep Medicine 2016).
As the choice to delay high school start times grows increasingly controversial, on October 13, 2019, California Governor Gavin Newsom signed Senate Bill 328 into law, thereby mandating nearly all 4-year public high schools in California to delay school start times to 8:30 AM at the earliest beginning in the summer of 2022 (Hauser & Kwai 2019). Senate Bill 328 represents the first large-scale legislative move towards adopting delayed high school start times. As sleep deprivation among teenagers continues to gain national awareness, individual high schools and their districts across the United States have begun shifting bell schedules to a later time.
While several existing studies have analyzed the effects of delayed school start times as a potential solution, they vary in methodology, scope, and results. More significantly, as public education falls within individual state-by-state jurisdiction, there is no comprehensive nationwide database that collects annual educational outcome data by high school over the span of the past two decades. As such, few studies have analyzed the effects of delayed school start times on graduation rates on a national level.
This paper will examine the direct and indirect effects of delayed high school start times on graduation rates. More specifically, it will examine all American high schools that have delayed their school start times from the past decade, gathering national graduation data from over 140 high schools spanning 31 states, from as early as 2007 to 2020. As a significant amount of time has passed and a greater number of high schools across the country are beginning to implement later school start times, this paper serves as a unique, opportunistic, and relevant resource to examine the effect of start times on graduation rates. Most importantly, this paper will discuss delayed start times as not simply a binary variable, but rather, a variable measure of whether larger delays in school start times lead to different effects in graduation rates over time as compared to smaller delays in start times. This analysis will include more than simply whether high school have delayed start times, but rather, original start time prior to implementation of delay as well as post-delay start time, to conduct an analysis of how graduation rates over time increase as delay in school start times increase, adopting several methods of analysis, including the event study methodology, pooled cross-sectional difference-in-differences, and paneled cross-sectional difference-in-differences.
II. Literature Review
A. Effect of Sleep on Academics
There is little literature on the effect of delaying school start times on graduation rates, but existing studies have long established the importance of receiving sufficient sleep among adolescents. Wong et al. (2013) found direct effects of sleep duration on academic, physical, and psychological functions of college students, through the reduction of irritability and mood changes during the day. Similarly, Gilbert and Weaver (2010) examined the effect of students’ sleep quality on their academic results, such as the Grade Point Average (GPA), concluding a statistically significant association between lower sleep quality and lower GPA’s. Building off Gilbert and Weaver, Okano et al. (2019) discovered the positive correlation between better quality, longer duration, and greater consistency of sleep on academic performance. As such, receiving sufficient sleep has been widely accepted as a crucial factor in determining student academic outcomes.
B. Delayed Start Times and Sleep Duration
Having established the importance of sleep among adolescents, existing studies have also examined the potential relationship between delaying school start times and average sleep duration of high school students. Owens et al. (2010) determined that a 30-minute delay in school start time led to a mean increase of 45 minutes in sleep duration, improved motivation, decreased fatigue, and increased attendance. By conducting a controlled experiment on n = 201 students in an independent high school in Rhode Island, a multitude of improvements in sleep quality and duration were measured: the percent of students reporting over 8 hours of sleep increased from 16.4% to 54.7%, while the percent of students reporting less than 7 hours of sleep decreased by 79.4%.
However, delaying school start times may potentially lead to later sleep schedules, rather than simply increasing sleep duration, potentially leading to other unforeseen consequences. In Vollmer et al. (2013), depending on circadian rhythm preferences, students were classified as either morning-oriented or evening-oriented, synonymous with the more colloquially known “early bird” and “night owl”, respectively. The study, using self-reported data from students from ages 10 to 17, determined that morning-oriented students achieved higher academic performance in high school and received higher scores on attention span tests as compared to the evening-oriented students. By delaying school start times, evening-oriented students benefit more from the shift in schedule than morning-oriented students. In addition, the delay may potentially cause students who were previously morning-oriented to become evening-oriented students. The study suggested that as adolescents advance into their teenage years, their bodies switch from morning-oriented to evening-oriented, ultimately recommending delayed school start times by one hour for students, particularly for evening-oriented students.
Few studies have examined the explicit relationship between delayed school start times and graduation rates. Of these, McKeever & Clark (2017) resembles a study most relevant and most similar in methodology to this paper, examining graduation rates in 29 high schools across 7 states. By comparing graduation rates pre-delay and post-delay, McKeever & Clark determined that delaying school start times to after 8:30 AM led to a statistically significant increase in graduation rates. However, McKeever & Clark limited their analysis to high schools that only delayed school start times from before 8:30 AM to after 8:30 AM, regardless of the delay length. Despite this, their study’s hypothesis and results support existing medical research and suggest that delayed school start times lead to increased sleep duration, translating to higher academic performance.
III. Data
A. Event Study Panel Data
To obtain a list of high schools that have implemented a delay in school start time, this paper draws data from several online resources. Of these, StartSchoolLater.net, a coalition dedicated to promoting awareness between school hours and sleep health among teenagers, provides an online database that contains an extensive list of all schools and/or school districts that implemented delays in school hours over the past two decades, as well as each school’s original bell schedule start time and delayed bell schedule start time. Following extensive research and verification, this resource was identified as a trustworthy, unbiased tool, especially as it cites and links individual sources for each high school listed.
The identified high schools from StartSchoolLater.net was also cross listed with a separate independent source, SchoolStartTime.org, which also catalogs a near comprehensive list of all high schools that have implemented school start time delays since the 2000’s. To ensure the reliability of these sources, each data point has been extensively cross listed with relevant news articles and/or districtwide announcements to corroborate the accuracy of each high school. By limiting the scope of this paper’s event study analysis to high schools that implemented start time changes from 2009 at the earliest, our analysis draws from a list of over 140 high schools spanning 31 states.
For the purposes of this paper, the graduation rate is defined as the number of students graduating in their 4-year cohort divided by the total number of students in the 4-year cohort group. As there is no central database by the United States Department of Education with records of high school 4-year cohort graduation rates by year, graduation rate data was imported directly from individual states’ official Department of Education websites. Nearly all states’ Department of Education websites have some collection of graduation rate records by high school. These resources were considered the most reliable, direct source for graduation rate data, particularly as these state government agencies are mandated by law to report accurate and timely data on high school educational outcomes. This data was individually identified and imported by sifting through over thirty State Department of Education websites, eventually compiling a spreadsheet of schoolwide graduation data from T = -3 years before the delayed school start time, to T = 3 years after the delayed start time.
To control for fixed characteristics by school such as average countywide household income and gender ratio, data was pulled from the same Department of Education websites. Demographic data such as race and gender were strictly localized to each graduating senior class within each high school. Average household income data was drawn from the Federal Reserve Bank of St. Louis, which continually updates with a database of average real median household income values from 1984 to 2020.
An example entry point, as shown in Table 1, displays graduation rate data and other control variables for Heritage High School, located in the state of Washington. In the 2016-2017 school year, Heritage High School implemented a later start time of 8:40 AM from its previous start time of 7:30 AM. Its graduation rate data was compiled from the Washington State Department of Education’s website from the 2013-2014 school year, 2014-2015 school year, and 2015-2016 school year. These three points represent graduation rates prior to the delayed school start time. Heritage HS’s graduation rate from the 2016-2017 school year, 2017-2018 school year, 2018-2019 school year, and 2019-2020 school year was also collected to measure the effect of the delayed school start time up to three years after the implemented change. For their respective years, the percent of male students belonging to Heritage High school’s graduating class, as well as county-level income data, was also collected and reported below. This process was repeated for over 140 other high schools across the country. Table 1 displays the collected data for Heritage High School.
TABLE 1: Example Entry Point
School: Heritage High School
State: Washington
Original School Start Time: 7:45 AM
Delayed School Start Time: 8:40 AM
Time Change: 55 minutes
Year or Start Time Change: 2016
| Year | Graduation Rate | % Male | Avg Income |
|---|---|---|---|
| 2013 | 0.763 | 0.5103 | 57886 |
| 2014 | 0.805 | 0.5313 | 61747 |
| 2015 | 0.804 | 0.5196 | 64282 |
| 2016 | 0.816 | 0.5316 | 68937 |
| 2017 | 0.867 | 0.5436 | 74243 |
| 2018 | 0.881 | 0.4808 | 73971 |
| 2019 | 0.902 | 0.5376 | 80407 |
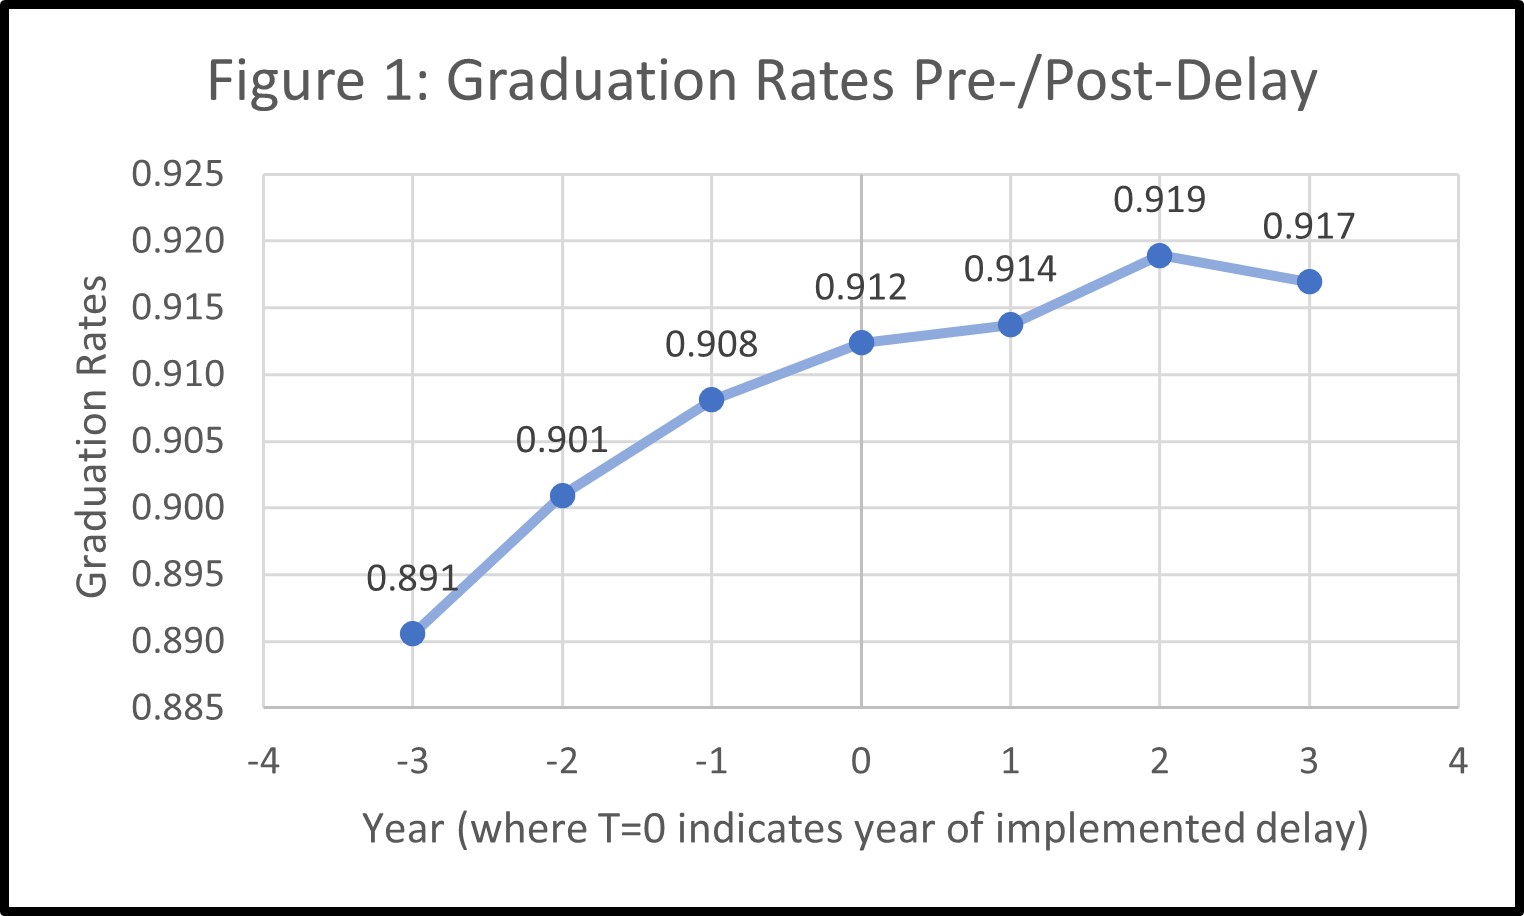
Table 2 below reports summary statistics for graduation rates by year (T = -3, -2, … 3), original school start times, delayed school start times, and time change (delayed time – original time).
TABLE 2: Summary Statistics
| Year | Original Time | New Time | Time change | Graduation Rate | |||||||
|---|---|---|---|---|---|---|---|---|---|---|---|
| T=-3 | T=-2 | T=-1 | T=0 | T=1 | T=2 | T=3 | |||||
| Mean | 2016.08 | 7:32:29 AM | 8:26:03 AM | 53 min 35 sec | 0.891 | 0.901 | 0.908 | 0.912 | 0.914 | 0.919 | 0.917 |
| Standard Error | 0.23 | 1 min 10 sec | 1 min 39 sec | 1 min 47 sec | 0.007 | 0.006 | 0.006 | 0.005 | 0.006 | 0.005 | 0.008 |
| Median | 2017.5 | 7:30:00 AM | 8:30:00 AM | 1 hour | 0.900 | 0.920 | 0.930 | 0.928 | 0.937 | 0.938 | 0.933 |
| Mode | 2018 | 7:30:00 AM | 8:30:00 AM | 1 hour | 0.860 | 0.950 | 0.965 | 0.968 | 0.960 | 0.954 | 0.970 |
| Standard Deviation | 2.7382 | 13 min. 57 sec | 19 min 48 sec | 21 min 28 sec | 0.074 | 0.065 | 0.067 | 0.060 | 0.068 | 0.058 | 0.059 |
| Range | 9 | 1 hr 15 min | 1 hr 35 min | 1 hr 45 min | 0.296 | 0.319 | 0.336 | 0.273 | 0.364 | 0.268 | 0.271 |
| Minimum | 2009 | 7:00:00 AM | 7:40:00 AM | 20 min | 0.693 | 0.673 | 0.656 | 0.723 | 0.627 | 0.722 | 0.729 |
| Maximum | 2018 | 8:15:00 AM | 9:15:00 AM | 2 hours | 0.989 | 0.992 | 0.992 | 0.996 | 0.991 | 0.990 | 1.000 |
| Count | 144 | 144 | 144 | 144 | 128 | 130 | 132 | 132 | 133 | 127 | 58 |
Figure 1 presents a visual representation of the average graduation rates by year (T = -3, -2, …, 3). There is a clear rising trend in graduation rates from T = -3 to T = 2. The slight decrease in graduation rates at T = 3 may be due to several factors. Firstly, the sample size for data points at the T = 3 level is significantly smaller than during other years, as many high schools who implemented start time changes in recent years, such as the 2017-2018 school year, have not yet posted graduation rate or other demographic data at the third post-implementation year, or for the 2020-2021 school year. This is also reflected by the lower count sizes for T = 3 as displayed in Table 2. Additionally, external factors such as COVID-19 may have affected graduation rate data for schools whose implementation year was 2017 or later, to be addressed via a difference-in-differences regression model. Lastly, it may be plausible that the effects of additional sleep per night due to a delayed school start time may be wearing off at T = 3 years after the schedule change, as students who are graduating at T = 3 may already have had four years of exposure to the new schedule since their freshman year.
The results drawn from this study are intended to be generalized to all high schools in the United States. However, it should be noted that the sources used for this paper are limited to a convenience sample from StartSchoolLater.net and various other online sources. Although the high schools analyzed in this study did not originate from a completely randomized sample, they represent a near exhaustive list of all high schools in the United States that have delayed school start times in the past decade. As such, the scope, size, and methodology of the data gathering process expands the generalizability of this paper’s analysis of all high schools in the United States. Additionally, it should be noted that graduation rates from the 2019 to 2020 school year may be affected by external factors due to COVID-19, which may be challenging to control for, as the analysis has normalized the implementation year of delayed start times for all schools to T = 0.
B. Difference-in-Differences Methodology Data
The event study methodology utilizes pre-delay school graduation rate data and post-delay data to determine whether an implemented delay in school start time leads to a statistically significant increase in graduation rates, up to three years after the change. However, this method may not consider the national trend of increasing graduation rates across all U.S. high schools over the past decade, irrespective of school start time. As such, a difference-in-differences methodology may be necessary to isolate the effect of delayed school start times on graduation rates.
Rather than compiling data on all U.S. high schools that have delayed start times, the difference-in-differences method will look solely at 4-year public high school outcomes in Florida from the 2016-2017 school year to 2021-2022 school year. Beginning in the 2018-2019 school year, all four-year high schools in the Hillsborough School District began their school days at 8:30 AM or later, a full hour departure from their previous bell schedule start time of 7:30 AM (Sokol 2017). The decision to delay school start times was passed in a unanimous vote by the Hillsborough County Public School Board, affecting over 27 high schools in the region.
This measure, coupled with publicly available data of all Floridian public high school graduation rates, gender demographics, and racial breakdown, provides an opportunistic case study into the effect of a one-hour delay in high school start times on graduation rates, especially since the database of the Florida Department of Education website was particularly robust and comprehensive relative to other states. Looking at all high schools in Florida and eliminating private schools, charter high schools and specialized/technical high schools, a finalized list of 345 high schools were identified, of which 27 high schools belonged to the Hillsborough Public School District, representing the treatment group. The remaining 318 high schools serve as the control group.
Following a similar data-gathering process as described in Section 3.1, control variables were considered; gender ratio and racial breakdown of each year’s respective graduating senior class was consolidated from the Florida Department of Education websites, as well as through individual data requests to the Florida Department of Education via e-mail/phone communication. As before, average household income data per county was drawn from the Federal Reserve Bank of St. Louis.
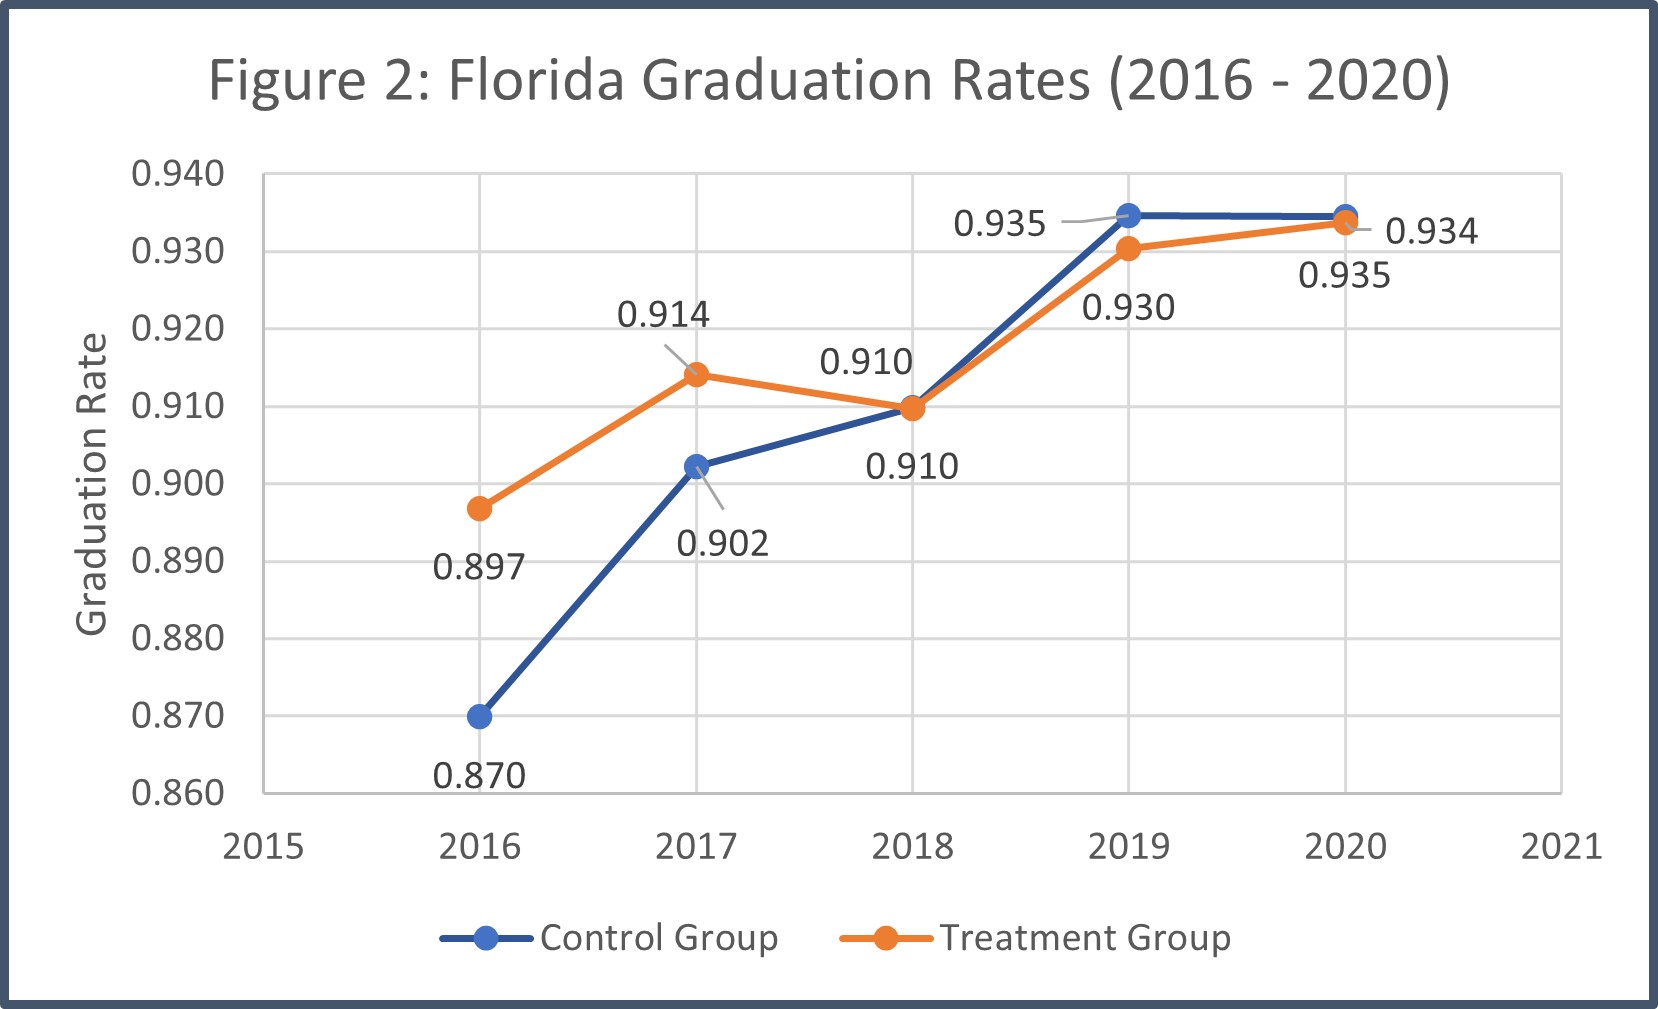
Figure 2 shows a comparison of the change in graduation rates of Florida public high schools from 2016 to 2020. Average graduation rates of the 27 high schools in the Hillsborough Public School District, also known as the treatment group, are graphed in orange. The graduation rates of the control group, or all remaining high schools in Florida, are graphed in blue. As expected, from 2016 to 2021, the average four-year public high school in the control group saw increases in graduation rates over time. Hillsborough District high school graduation rates were more volatile, with a slight decrease in graduation rates in the implementation year (2018-2019 school year). In addition, it should be noted that the Hillsborough District high schools are better performing schools prior to treatment, with higher average graduation rates in the 2016-2017 school year, as well as 2017-2018 school year.
The goal of the difference-in-differences regression is to identify the differences of graduation rate outcomes over the four-year period during which the treatment group (Hillsborough Public School District) delayed its morning start time by one hour, compared to the control group (all other four-year public high schools in Florida), while accounting for gender and racial demographic and income control variables.
IV. Methodology
A. Pre-Analysis Data Cleaning
As graduation data is not available on the national level, graduation rates must be independently retrieved from individual State Department of Education databases, by first browsing 4-year graduation rate data by district, then by school, and finally, by year. Graduation rates were analyzed and reported by up to three significant figures. For certain years prior to 2010 or after 2020, graduation rate data was not available for various schools. Schools that lacked graduation rate data for all six years—three years prior to implemented start time delay, three years after the implemented schedule change—were removed from the dataset. Demographic information with regards to gender were also collected from Department of Education websites and were reported by up to four significant figures. Binary variables were generated to indicate the year relative to implemented change. The binary variable DELAY_DUMMY equals 0 if its associated data was recorded prior to the implemented start time change, and 1 if its data represents post-change results. A new variable named DELAY_DUMMY_MINUTES was also generated, representing the product of DELAY_DUMMY and MINUTES. The purpose of this variable is to examine the effect of each additional minute of delay on graduation rates.
B. Event Study Regression
To best measure the effect of school start time on graduation rates, linear regression analysis was conducted using event study methodology. This methodology is largely applied in cases in which a certain event may or may not have abnormally affected another associated variable, therefore determining the significance of the event. This method is primarily seen in financial applications, studying the impact of certain events on a firm’s value. The event study methodology is most trustworthy when measuring characteristics that do not change over time, and therefore requires the assumption that graduation rates, nationally, have remained constant, unless mitigated by time fixed effects and additional control variables.
After cleaning and isolating all relevant data points, a preliminary linear regression can be run to determine the effect of implementing a delay in school start times and magnitude of delay on graduation rates, by regressing graduation rate on binary variable DELAY_DUMMY and interaction term DELAY_DUMMY_MINUTES:
(1) $$\ G_{i,t}=β_0+β_1DELAY\text{_}DUMMY_{i,t}+β_2DELAY\text{_}DUMMY\text{_}MINUTES_{i,t}+ε_{i,t}$$
The regression clusters the variance-covariance at the school level to best capture the differences between graduation rate per school. represents the increase in graduation rates following an implemented delay in high school start times. represents the increase in graduation rates for every additional minute delay. The focus of this regression will be on and , to best measure the effects of a delayed school start time on graduation rates.
Taking a deeper dive into the data, a secondary linear regression can be performed taking into account the varying fixed effects and other factors that may affect graduation rates, specifically, the percent of graduating class that is male as well as average county-level income in their respective years. While studies have long established the positive correlation between household income and academic performance (Reardon 2018), recent studies have also uncovered a rising academic gap between female students and male students, with the former consistently receiving higher grades, higher graduation rates, and higher college-going rates than the latter (Reeves et al. 2022). To best interpret income data, a new variable, INCOME, was generated, taking the natural logarithm of average county household income. Using gender ratio and household income data, the regression provides a more accurate depiction of the effect of delayed school start times on graduation rate, reducing margins of error.
(2) $$G_{i,t}=β_0+β_1DELAY\text{_}DUMMY_{i,t}+β_2DELAY\text{_}DUMMY\text{_}MINUTES_{i,t} + β_3MALE_{i,t}+β_4 INCOME_{i,t}+ δ_i+δ_t+ε_{i,t}$$
Clustering the variance-covariance at the school level, once again represents the increase in graduation rates following an implemented delay in high school start times and represents the increase in graduation rates for every additional minute delay. represents the increase in graduation rates following a 20-minute delay in school start time. represents school level fixed effects, accounting for different conditions across various schools. represents time level fixed effects, due the variations in graduation rates in different years.
As graduation rates may increase due to external factors over time in the past decade, these fixed effects are intended to account for the upward trends in academic performance, especially considering certain factors such as the recovery following the 2008 recession or the 2020 COVID-19 pandemic. Dummy variables representing the years preceding and following the schedule change are generated, normalizing the year of implementation at time t = 0. As an example, TM3 (T minus 3 years) has a value of 1 to indicate graduation rate and other control variable data points that was exposed to the delayed schedule change T = 3 years after the implementation, with a value of 0 for all other years. A total of six dummy variables are generated: TM3 (T minus 3 years), TM2 (T minus 2 years), T0 (Implementation year), TP1 (T plus 1 year), TP2 (T plus 2 years), and TP3 (T plus 3 years). To avoid multicollinearity, the dummy variable for TM1 (T minus 1 year) is omitted from the regression, as per standard econometric convention.
The addition of these time dummy variables to the previous regression culminate in a another interpretation of the data:
(3) $$G_{i,t}=β_0+β_1 DELAY\text{_}DUMMY_{i,t}+β_2 DELAY\text{_}DUMMY\text{_}MINUTES_{i,t}+β_3 TM3_{i,t} + β_4 TM2_{i,t}+β_5T0_{i,t}+β_6 TP1_{i,t}+β_7 TP2_{i,t}+β_8 TP3_{i,t} + β_9 MALE_{i,t}+β_{10} INCOME_{i,t}+ δ_i+δ_t+ε_{i,t}$$
Finally, a thorough analysis of the data calls for additional fixed effects centered around the school level and year. The reghdfe command in STATA allows for linear and instrumental-variable regressions to be performed with many levels of fixed effects, by implementing the estimator by Correia (2015). To analyze graduation rates, two levels of fixed effects must be accounted for: high school and year. By utilizing the following command in STATA, the direct effect of school start time on graduation rates can be more accurately measured, while accounting for time-varying school fixed characteristics:
(4) reghdfe GRAD DELAY_DUMMY DELAY_DUMMY_MINUTES TM3 TM2 T0 TP1 TP2 TP3 MALE INCOME , absorb(School) vce(cluster School)
(5) reghdfe GRAD DELAY_DUMMY DELAY_DUMMY_MINUTES MALE INCOME , absorb(School Year) vce(cluster School)
In the command above, Grad represents graduation rates, the dependent variable to be analyzed. DELAY_DUMMY and DELAY_DUMMY_MINUTES are the independent variables, as discussed previously. TM3, TM2, T0, TP1, TP2, and TP3 represent control variables, for T = -3, -2, …, 3, respectively. MALE and INCOME are additional control variables. Equation (4) does not account for yearly fixed effects, opting to utilize the time dummy variables relative to implementation year. Equation (5) accounts for both year fixed effects and school-level fixed effects, without the six time binary variables. These regressions should provide the most accurate, unconfounded depiction of the effect of delayed school start times on graduation rates, controlling for gender, income, and year and school fixed effects.
The key limitations of the event study methodology are that the analysis does not control for selection bias caused by changes over time other than the event of interest. As national graduation rates have, in general, increased over time, the difference-in-differences methodology may be an alternative solution to identify the effect of delayed start times on graduation rates.
C. Difference-In-Differences Methodology
A difference in differences methodology estimates the effects of a certain treatment by examining the changes in differences of outcomes between treatment and control groups over time. The methodology is best implemented for observational study data in which confounding variables and other factors may be hard to identify and measure, while also reducing the potential for selection bias in the event study methodology regression.
There is large potential for a difference in differences approach in analyzing the effect of delayed school start times on graduation rates. While an event study methodology measures the effect of school start times on graduation rates pre-implementation and post-implementation, it may not account for the overall rise in graduation rates nationwide over the past decade. Through policies such as No Child Left Behind (NCLB), increased accountability for high schools to perform well as measured through academic metrics have led to a dramatic rise in graduation rates, reflected by an overall increase of 8 percentage points in the percent of 18–24-year old’s with a high school diploma from 2001 to 2016 (Harris et al. 2016). As a result, it is necessary to view the increase in graduation rates over time through a difference-in-differences lens, by comparing the performance of high schools who have implemented a delay in school start times to similar high schools who have not.
The difference in differences approach relies on several key assumptions. First, as is the event study methodology, the allocation of treatment is not determined by outcome—the decision to delay morning start times could not have been determined by expectations of future graduation rates. Secondly, treatment groups and control groups are assumed to have parallel trends in graduation rates. This can be logically reasoned, as all high schools in the dataset, regardless of the decision to delay start time, belong to an interconnected national education system that is susceptible to the nationwide trends and various other factors affecting graduation rates at a relatively equal level. As such, in the hypothetical absence of treatment, the difference in graduation rates of the treatment group and control group should remain constant over time. Third, there exists no spillover effects—the decision to delay start times in one high school should not affect the graduation rates of a neighboring high school.
A new binary variable, TREATMENT, differentiates between schools belonging to the treatment group, which are the 27 schools in the Hillsborough Public School District, and all other Floridian high schools, which did not delay its morning start times from 2016 to 2020, with a value of 1 assigned to the former, and a value of 0 assigned to the latter. DELAY_DUMMY remains relevant, with a value of 0 for pre-delay data (from the 2016-2017 school year and 2017-2018 school year), and a value of 1 for post-delay data (starting in the 2018-2019 school year and onwards). The preliminary, pooled difference-in-differences regression is as follows:
(6) $$ G_{i,t}=β_0+β_1 TREATMENT_{i,t}+β_2 DELAY\text{_}DUMMY_{i,t}+β_3 TREATMENT\text{_}DELAY_{i,t}+ε_{i,t}$$
TREATMENT_DELAY is the interaction term between TREATMENT and DELAY_DUMMY, and its coefficient is the focus of the regression, representing average differential change in graduation rates from 2016 to 2020 of the treatment group, relative to the control group. represents the average difference in graduation rates between the treatment group and control group. represents average increase in graduation rates for both the treatment group and control group, also interpreted as the statewide increase in graduation rates regardless of start time.
Controlling for gender, race, and average household income, the pooled difference-in-differences method utilizes all variables in the dataset as follows:
(7) $$G_{i,t}=β_0+β_1 TREATMENT_{i,t}+β_2 DELAY\text{_}DUMMY_{i,t}+β_3 TREATMENT\text{_}DELAY_{i,t} + β_4 INCOME_{i,t}+β_5 MALE_{i,t}+ β_6 WHITE_{i,t}+β_7 BLACK_{i,t}+β_8 HISPANIC_{i,t}+ε_{i,t}$$
INCOME represents the natural logarithm of average household income by county in which the high school is located. MALE, WHITE, BLACK, and HISPANIC represents the percent of the senior graduating class that belongs in each respective gender and racial demographic.
One drawback of the pooled difference-in-differences analysis, as shown above, is that it does not account for year-to-year effects. To address this, the data set can also be treated as a panel data, using the same difference-in-differences methodology. Rather than interacting TREATMENT with DELAY_DUMMY, the former variable is interacted with individual time binary variables TM2, T0, TP1, and TP2. The regression can be rerun as:
(8) $$G_{i,t}=β_0+β_1 TREATMENT_{i,t}+β_2 TREATMENT\text{_}TM2_{i,t}+β_3 TREATMENT\text{_}T0_{i,t} + β_4 TREATMENT\text{_}TP1_{i,t}+β_5 TREATMENT\text{_}TP2_{i,t} + β_6 TM2_{i,t}+β_7 T0_{i,t}+β_8 TP1_{i,t}+β_9 TP2_{i,t}+ε_{i,t}$$
to are key to understanding the average differential change in graduation rates of the treatment group, relative to the control group for each individual year, from two years prior to the implemented start time delay (T = – 2) to two years after the schedule change (T = 2). represents the average difference in graduation rates between the treatment group and control group. to highlights the individual yearly fixed effects on increasing graduation rates for both the treatment group and control group. As usual, control variables such as gender, race, and income will also be accounted for in the final regression.
V. Results
Regression results in accordance with the events study methodology from Section 4.1 are displayed in Table 3 below.
The first regression (Column 1, see Equation 1) offers a preliminary look at the effect of the binary variable DELAYED_DUMMY and the interaction variable DELAYED_DUMMY_MINUTES on graduation rates, clustering the variance-covariance at the individual high school level. The second regression (Column 2, see Equation 2) runs the same linear regression as the first, while controlling for gender and income data. The third regression (Column 3, see Equation 3) factors in binary time variables in addition to the control variables from the previous regression. The fourth and fifth regression (Equations 4 and 5) control for two-level fixed effects at the school level and year, with the former using binary time variables () relative to implementation, and the latter using individual years independent of implementation year (2006 to 2021).
Table 3: Event Study Methodology Regression
| VARIABLES | (1) Grad | (2) Grad | (3) Grad | (4) Grad | (5) Grad |
|---|---|---|---|---|---|
| Delay_Dummy | 0.0657*** (0.00921) |
0.0171 (0.0119) |
-0.0149* (0.00883) |
-0.0348*** (0.00910) |
|
| Delay_Dummy_Minutes | -0.000945*** (0.000151) |
-0.000314 (0.000212) |
-0.000304 (0.000212) |
0.000665*** (0.000180) |
0.000687*** (0.000167) |
| TM3 | -0.00214 (0.00489) |
-0.00277 (0.00495) |
|||
| TM2 | -0.00180 (0.00395) |
-0.00256 (0.00340) |
|||
| ΤΟ | 0.0179* (0.0108) |
-0.0160** (0.00654) |
|||
| TP1 | 0.0138 (0.0115) |
-0.0151*** (0.00543) |
|||
| TP2 | 0.0133 (0.0123) |
-0.0122** (0.00481) |
|||
| TP3 | 0.0187 (0.0132) |
||||
| Male | -0.187** (0.0930) |
-0.187** (0.0935) |
-0.0437 (0.0550) |
-0.0664 (0.0534) |
|
| LogIncomel | 0.111*** (0.0174) |
0.112*** (0.0177) |
0.0421 (0.0387) |
0.0847** (0.0372) |
|
| Constant | 0.900*** (0.00578) |
-0.223 (0.203) |
-0.225 (0.206) |
0.470 (0.419) |
0.0128 (0.408) |
| Observations | 840 | 678 | 678 | 678 | 677 |
| R-squared | 0.071 | 0.259 | 0.260 | 0.849 | 0.857 |
| School FE | NO | NO | NO | YES | YES |
| Year FE | NO | NO | NO | NO | YES |
Robust standard errors in parentheses
*** p<0.01, ** p<0.05, ** p<0.1
Analyzing the results from the first regression, implementing a delay in school start times led to a predicted 6.57% increase in graduation rates, while every additional minute of delay led to an average decrease of 0.0945% in graduation rates. Both coefficients are statistically significant at the 99% confidence level. Controlling for gender and income, the second regression indicates a weaker correlation between delayed start times and graduation rates, at just 1.71%. Each additional minute delay leads to an estimated 0.0314 decrease in graduation rates. However, both values are not statistically significant.
The third linear regression controls for time, gender, and income, while maintaining the same dependent and independent variables as before. In this regression, the coefficient for DELAY_DUMMY was omitted, likely due to dependency among the independent variables. According to the regression results in Table 3, the effect of delaying school start times by an additional minute led to a predicted decrease of 0.0304% in graduation rates, although this relationship is not statistically significant.
As expected, percent male in the graduating class is consistently negatively correlated with graduation rates. For each additional 1% increase in male students per cohort, graduation rates were estimated to decrease 18.7% at a statistically significant level. In addition, average household income was highly correlated with graduation rates as well, with an estimated 11.2% increase in graduation rates for each additional 1% increase in household income. This relationship was also statistically significant at the 99% confidence interval.
The fourth and fifth regression provides the most accurate event study methodology thus far, by incorporating two-level fixed effects of high school and year, in addition to the existing control variables identified above. The fourth regression does not account for yearly fixed effects, opting to utilize the time dummy variables relative to implementation year. According to the regression results, a delay in start times leads to an expected 1.49% decrease in graduation rates. Each additional minute delayed in school start time leads to a graduation rate increase of 0.067%. Both coefficients are statistically significant at the 90% confidence level or more. Extrapolating these results to determine the breakeven point, the numbers indicate that a delay exceeding 22.4 minutes will result in a positive change in graduation rate data, whereas a delay of 22.4 minutes or less will decrease expected graduation rates. However, it should be noted that the model predicts slight decreases in graduation rates during the post-implementation years, as indicated by the negative coefficients associated with the time binary variables T0, TP1, TP2, and TP3.
Accounting for both year and school level fixed effects, the fifth regression model estimates that a delay in school start times leads to a statistically significant 3.48% decrease in graduation rates, with every additional minute delay reducing this impact by 0.069%. Extrapolating these results once again, the model indicates that a delay exceeding 50.7 minutes will result in a positive change in graduation rates, whereas anything less will lead to negative changes in graduation outcomes.
Consistently across all models, male ratio is negatively correlated with graduation rates, and income is positively correlated with graduation rates.
The first two columns correspond to Equations 6 and 7 from Section 4.3, using a pooled data difference-in-differences analysis. The third and fourth regression uses paneled data difference-in-differences analysis, with the former corresponding to Equation 8, and the latter controlling for gender, race, and income.
Table 4 displays the results for the difference-in-differences model regression.
Table 4: Difference-in-Differences Methodology Regression.
| VARIABLES | (6) Grad | (7) Grad | (8) Grad | (9) Grad |
|---|---|---|---|---|
| Treatment | 0.0188* (0.0100) |
0.00164 (0.00967) |
0.0111 (0.00974) |
0.00219 (0.00969) |
| Delay Dummy | 0.0398*** (0.00237) |
0.00958*** (0.00231) |
||
| treatment delay | -0.0207*** (0.00535) |
-0.0144*** (0.00493) |
||
| treatment TM2 | 0.0154*** (0.00552) |
|||
| treatment_TO | -0.0114* (0.00623) |
-0.0121* (0.00637) |
||
| treatment TP1 | -0.0159*** (0.00602) |
-0.0164*** (0.00618) |
||
| treatment TP2 | -0.0117* (0.00617) |
-0.0141** (0.00622) |
||
| TM2 | -0.0326*** (0.00245) |
|||
| ΤΟ | 0.00706*** (0.00217) |
0.000530 (0.00203) |
||
| TP1 | 0.0322*** (0.00259) |
0.0190*** (0.00273) |
||
| TP2 | 0.0313*** (0.00288) |
0.0119*** (0.00348) |
||
| LogIncomel | 0.120*** (0.0182) |
0.111*** (0.0190) |
||
| Male | -0.00633 (0.0628) |
-0.0108 (0.0626) |
||
| White | -0.167** (0.0706) |
-0.161** (0.0711) |
||
| Hispanic | -0.165** (0.0667) |
-0.161** (0.0670) |
||
| Black | -0.191*** (0.0696) |
-0.185*** (0.0700) |
||
| Constant | 0.887*** (0.00381) |
-0.239 (0.207) |
0.903*** (0.00371) |
-0.146 (0.214) |
| Observations | 1,725 | 1,135 | 1,725 | 1,135 |
| R-squared | 0.084 | 0.154 | 0.127 | 0.168 |
Robust standard errors in parentheses
*** p<0.01, ** p<0.05, ** p<0.1
The pooled data difference-in-differences model (Column 6 and 7) indicate that the positive change in graduation rates of high schools in the Hillsborough Public School District that implemented a delay in morning start times was less than those of the control group, by 2.07%. When controlling for income, male, and race, the difference in differences decreases to 1.44%, but the correlation is still negative. This indicates that the graduation rates of the control group, Floridian high schools that did not delay morning start times, increased at a larger rate than that of the treatment group from 2016 to 2021. Both values are statistically significant at the 99% confidence level. The positive coefficients on the TREATMENT variable indicate that the Hillsborough high schools, on average, had statistically higher graduation rates than the average four-year public high school in Florida during this period. In addition, the positive coefficients on the DELAY_DUMMY variable indicates that statewide graduation rates increased by 3.98% in the first model, and by 0.958% in the second model with control variables. These values are also statistically significant at the 99% confidence level.
The paneled difference-in-differences model (Column 8 and 9) offers a deeper look into the effects of implementation by year, while continuing to provide evidence that delayed school start times did not benefit high school graduation outcomes, but rather, inhibited graduation rate growth over time. As gender and racial demographic data was not available for the 2016-2017 school year, the analysis omitted coefficients on the TREATMENT_TM2 and TM2 variables. On year of implementation, graduation rates of the treatment group increased by 1.14% less than the increase of statewide control group’s graduation rates, as evidenced by the negative coefficients on the TREATMENT_T0 variable. Controlling for demographic and income data, this relationship increased to a 1.21% negative difference in graduation rate increases. Similarly, negative coefficients on TREATMENT_TP1 and TREATMENT_TP2 continue this negative trend: a negative 1.59% difference in graduation rate changes one year after implementation and a negative 1.17% difference in expected graduation rate changes two years following the schedule change. Controlling for gender, race, and income, these values remain negative: 1.64% one year following the treatment, and 1.41% two years following the treatment. These values are all statistically significant.
These results are especially notable when considering the statistically significant positive trend in graduation rates as evidenced by positive coefficients on the T0, TP1, and TP2 variables. As before, the positive terms on the TREATMENT variable indicates that Hillsborough County Public High Schools originally had higher graduation rates prior to treatment.
VI. Conclusion
The aim of this paper has been to analyze the effect of delayed high school start times on graduation rates. The prevalence of sleep deprivation among teenagers, coupled with increasing literature on the importance of sleep for adolescent development, has triggered national attention in recent years towards the potential solution of delaying high school start times. Despite this, very few studies have provided an in-depth analysis of the effects of implementing such a policy. By examining over 140 high schools across 31 states in the past decade, this paper utilized observational data, through the event study methodology and difference-in-differences methodology, to offer a first look at the real impacts of high school start times on academic performance.
Adopting the two-level fixed effects linear regression (Column 3 in Table 3), this paper revealed that delaying high school start times led to a statistically significant 3.5% decrease in expected graduation rates. However, every additional minute of school start time delay led to a 0.069% increase in graduation rates. These results indicate that only delays of 51 minutes or more will result in a positive change in graduation rate data. This can be attributed to several factors. It is most probable that short start time delays are not sufficient to increase average sleep duration enough such that academic performance can be improved. In fact, according to the two-layer fixed effect regression model, delays of about one hour or less actually led to a decrease in graduation rates, as doing so may have interrupted student sleep routines, decreased time for afterschool activities such as tutoring, as well as shifted sleep schedules to a later time rather than increasing sleep duration. These factors may result in more harm than good, whereas a dramatic delay of high school start times by over an hour may lead to large increases in sleep duration and quality, overshadowing the potential negative externalities involved with a delayed start schedule. Further research to examine these various factors is necessary, though the data for these variables are unavailable currently.
Although the data set for this study covers a span of 30 states and 140 high schools, there are still limitations in the event study methodology adopted by this paper’s analysis. The data points for this analysis covers a wide range of high schools, states, and years, and as such, it is difficult to account for the variations in high school performance by state over time, especially considering the general increase in graduation rates in the economic recovery in the post-2008 recession years. In addition, there may be other variables beyond household income and gender ratio that may be correlated with graduation rates. By increasing the number of control variables, it is possible to better focus this paper’s analysis on the direct effects of delayed school start times on graduation rates. Lastly, the methodology adopted by this paper relies on the assumption that the allocation of treatment is not determined by expectations of outcome. It may be the case that the decision whether to delay high school start times is related to school performance. Poorer-performing high schools may be more inclined to adopt a schedule change than high-performing high schools, to deviate from their status quo to improve student performance. High-performing high schools may be less inclined to adopt a delayed start time, as doing so would not provide any inherent benefits in an already high-achieving academic institution.
The results of this paper are somewhat contrary to those in the study conducted by McKeever & Clark (2017), which found improved graduation rates in high schools that implemented a delayed school start time of 8:30 AM or later. However, McKeever & Clark limited their analysis to 8 school districts across 7 different states, as identified by the Children’s National Medical Center’s Division of Sleep Medicine Research Team. Adopting a similarly pre-post event study methodology, the results of their study may not fully account for national rises in graduation rates over time, which may confound the true nature of the effects of delayed start times. McKeever & Clark’s approach falls under many of the similar limitations as outlined above as well.
Focusing on the difference-in-differences case study in Florida, the effect of delayed school start times becomes increasingly clearer, controlling for the statewide increase in graduation rates over the past years, gender, race, and income. In the pooled difference-in-differences regression, delayed morning start times led to an estimated 1.44% decrease in graduation rates of the Hillsborough Public School District High Schools, compared to the growth in graduation rates of all statewide high schools from 2016 to 2021. Breaking down this effect by year, the paneled data analysis indicates consistent negative correlations between high schools in the Hillsborough Public School district and the control group.
However, it should be noted that high schools in Hillsborough County were traditionally better performing institutions, with higher graduation rates compared to the average Floridian high school during this observational period. As graduation rates are capped at a maximum of 100%, this approach doesn’t consider the concave nature of graduation rates—Hillsborough public high schools in the treatment group may not have as much room for improvement as compared to peer institutions. This form of “selection bias” limits the capabilities of this model in making causal inferences of the true effect of delayed morning school start times.
As high schools across the United States continue to grapple with the decision to delay school start times, district board members and legislative policymakers should rethink whether the implementation of delayed school start times is necessary. While later morning start times may improve student attendance and tardiness rates, external consequences of such a move are still coming to light. Delayed start times leads to inevitable later end times in the afternoon, during which teenagers’ attention span wears thin, while reducing time for after-school rest and extracurricular activities. Logistical issues for parents of high school students with early workdays and with district bussing services conflicting with start times of elementary schools further complicate the effects of this well-intentioned move, potentially leading to disproportionate harm on students from low-income households, whose socioeconomic status already present a significant hurdle to overcome. Parents who may not have flexible schedules cannot afford to delay the start of their workday to adapt to later school start times (Mijares 2019). Legislation such as the California Senate Bill 328, which mandates all high schools begin no earlier than 8:30 AM, may bring increased hardship to socioeconomically disadvantaged children, particularly in a state where 45% of children live in low-income households, of which 46% are single-parent families. In 2015, researchers at the UC Sleep Laboratory raised questions on the effectiveness of delaying high school start times, citing that no sufficient evidence has yet concluded a positive correlation between high school start times and educational outcomes (Campbell & Feinberg 2015).
Further analysis may soon be feasible, as California Senate Bill 328 mandates a statewide delay in public high school start times to 8:30 AM at the earliest beginning in the summer of 2022. Similarly, in March of 2022, lawmakers in New Jersey have introduced new legislation mandating public high schools begin no earlier than 8:30 AM. Studies examining the direct impacts of this move will soon come to light in the coming years, providing a better understanding of the potential advantages and unseen consequences of implementing a start time delay. For now, lawmakers and district officials should remain wary of its promised benefits, especially as blind optimism drives the campaign for delayed high school morning start times across the nation.
VII. Acknowledgments
Many thanks to Professor Ernest Liu and Kecy Wu for their guidance, insights, and suggestions throughout all processes of my junior independent work research project. I have sincere gratitude for the support of the Princeton Economics Department, particularly the Economics Statistical Services (ESS). Special thanks to Jessica Min for the valuable insights on data methodology and STATA coding. Lastly, many thanks to friends and family for their boundless support.
VIII. References
American Academy of Sleep Medicine. “Late sleep timing linked to poorer diet quality, lower physical activity: Later sleep timing is associated with higher fast food intake as well as lower vegetable intake, physical activity.” ScienceDaily. https://www.sciencedaily.com/releases/2016/06/160608174254.htm (accessed March 20, 2022).
Campbell, Ian, and Irwin Feinberg. “Later School Start Times? Not so Fast.” Davis Enterprise, March 7, 2015. https://www.davisenterprise.com/forum/opinion-columns/later-school-start-times-not-so-fast/.
Centers for Disease Control and Prevention. (2020, August 20). CDC releases 2019 Youth Risk Behavior Survey Results. Centers for Disease Control and Prevention
Correia, Sergio. 2017. “Linear Models with High-Dimensional Fixed Effects: An Efficient and Feasible Estimator” Working Paper. http://scorreia.com/research/hdfe.pdf
Danner, Fred, and Barbara Phillips. “Adolescent Sleep, School Start Times, and Teen Motor Vehicle Crashes.” Journal of Clinical Sleep Medicine 04, no. 06 (2008): 533–35. https://doi.org/10.5664/jcsm.27345.
Gilbert, Steven P., and Cameron C. Weaver. “Sleep Quality and Academic Performance in University Students: A Wake-up Call for College Psychologists.” Journal of College Student Psychotherapy 24, no. 4 (2010): 295–306. https://doi.org/10.1080/87568225.2010.509245.
Harris, Douglas, Lihan Liu, Nathan Barrett, and Ruoxi Li. “Is the Rise of High School Graduation Rates Real? High-Stakes School Accountability and Strategic Behavior.” EdWorkingPaper, 2020. https://doi.org/10.26300/5jh6-0526.
Hauser, C., & Kwai, I. (2019, October 14). California tells schools to start later, giving teenagers more sleep. The New York Times.
McKeever, P. M., & Clark, L. (2017). Delayed high school start times later than 8: 30am and impact on graduation rates and attendance rates. Sleep Health, 3(2), 119-125.
Mijares, Al. “Later School Start Times Is No Solution for Teenagers.” CalMatters, October 4, 2019. https://calmatters.org/commentary/2019/10/later-school-start-times-is-no-solution-for-teenagers/.
Morgan, Leigh Ann. “Pros and Cons of Later School Start Times.” Sleeping Resources, January 17, 2012. http://sleepingresources.com/pros-and-cons-of-later-school-start-times/.
Okano, Kana, Jakub R. Kaczmarzyk, Neha Dave, John D. Gabrieli, and Jeffrey C. Grossman. “Sleep Quality, Duration, and Consistency Are Associated with Better Academic Performance in College Students.” npj Science of Learning 4, no. 1 (2019). https://doi.org/10.1038/s41539-019-0055-z.
Owens, Judith A., Katherine Belon, and Patricia Moss. (2010). “Impact of Delaying School Start Time on Adolescent Sleep, Mood, and Behavior.” Archives of Pediatrics and Adolescent Medicine, 164(7): 608-14.
Paruthi, Shalini, Lee J. Brooks, Carolyn D’Ambrosio, Wendy A. Hall, Suresh Kotagal, Robin M. Lloyd, Beth A. Malow, et al. “Consensus Statement of the American Academy of Sleep Medicine on the Recommended Amount of Sleep for Healthy Children: Methodology and Discussion.” Journal of Clinical Sleep Medicine 12, no. 11 (2016): 1549–61. https://doi.org/10.5664/jcsm.6288.
Reardon, Sean F. “The Widening Academic Achievement Gap between the Rich and the Poor.” Inequality in the 21st Century, 2018, 177–89. https://doi.org/10.4324/9780429499821-33.
Reeves, Richard V., Eliana Buckner, and Ember Smith. “The Unreported Gender Gap in High School Graduation Rates.” Brookings. Brookings, March 9, 2022. https://www.brookings.edu/blog/up-front/2021/01/12/the-unreported-gender-gap-in-high-school-graduation-rates/.
Sokol, Marlene. “It’s Official: Hillsborough High Schools Move to 8:30 A.m. Start Time, Elementary Schools to Go Earlier.” Tampa Bay Times. Tampa Bay Times, August 27, 2019. https://www.tampabay.com/news/education/k12/It-s-official-Hillsborough-high-schools-move-to-8-30-a-m-start-time-elementary-schools-to-go-earlier_161747593/#:~:text=TAMPA%20%E2%80%94%20Hillsborough%20County%20high%20schools,a.m.%20to%204%3A20%20p.m.
Suni, Eric. “Sleep for Teenagers.” Sleep Foundation, January 31, 2022. https://www.sleepfoundation.org/teens-and-sleep.
Thompson, M. M. (2020, November 11). National epidemic of underslept teenagers, & what parents can do about it. Cognitive Therapy in the San Francisco Bay Area.
Vollmer, C., Pötsch, F., & Randler, C. (2013). Morningness is associated with better gradings and higher attention in class. Learning and Individual Differences, 27, 167–173.
What does research reveal about later school start times for high schools? (2017). Retrieved November 12, 2021, from https://ies.ed.gov/ncee/edlabs/regions/northeast/AskAREL /Response/14.
Wheaton, Anne G., Sherry Everett Jones, Adina C. Cooper, and Janet B. Croft. “Short Sleep Duration among Middle School and High School Students — United States, 2015.” MMWR. Morbidity and Mortality Weekly Report 67, no. 3 (2018): 85–90. https://doi.org/10.15585/mmwr.mm6703a1.
Wong, Mark Lawrence, Esther Yuet Lau, Jacky Ho Wan, Shu Fai Cheung, C. Harry Hui, and Doris Shui MOK. “The Interplay between Sleep and Mood in Predicting Academic Functioning, Physical Health and Psychological Health: A Longitudinal Study.” Journal of Psychosomatic Research 74, no. 4 (2013): 271–77. https://doi.org/10.1016/j.jpsychores.2012.08.014.