Volume 32, Issue 1: Paper 3
Municipal Solid Waste Management and Climate Change: Evidence from Nepal
Prajjwal Dhungana, Kathmandu University School of Arts
Climate change has become one of the crucial challenges of today. The impacts of the issue manifest in variegated ways from long-term shifts in average temperature to the rise in sea levels, increase in heavy precipitation, droughts, natural disasters, and many more. Besides the physical ramifications of the issue, entrenched socio-economic consequences are burgeoning with time. These include a decrease in agricultural productivity (Sengar & Sengar, 2017), social inequalities (Singer, 2018), child marriage (Pope et al., 2022), and many more. Out of all, Municipal Solid Waste (MSW) is also an emerging dimension with far-flung consequences of climatic conditions.
MSW has become a complex and daunting task for municipalities across the world. Many factors affect the generation of MSW primarily ranging from the municipal population, income, type of population, age groups, employment, electricity consumption, inflation, and so on (Paulauskaite-Taraseviciene et al., 2022). According to Yao et al. (2018), 2.10 billion tons of solid waste are collected worldwide every year which is expected to grow to 3.40 billion tonnes by 2050. Not only exposing the existing MSW management and infrastructures to serious risk, but this also poses a huge financial and technical challenge to the municipalities of the future in dealing with it.
Thus, the dynamic relationship between the factors affecting MSW generation and management becomes crucial. Apart from the indispensable determiners, when climatic conditions – itself becoming ravaging day by day– significantly impacts MSW, the control over the situation slowly moves away from our hands. Thus, it becomes prominent to study the interactions between climate change and MSW generation and management. In addition to purporting resolves to the pernicious issue, the research will support the contemporary global movement against climate change ranging from the Paris Agreement (2015) to the Conference of the Parties 27 (2022), and also help policymakers design relevant policies against climate change and municipal Solid Waste.
A bidirectional relationship exists between climate change and MSW making it difficult to isolate the causality and direction of the effect. On one hand, the emission of a significant amount of methane and other Green House Gases (GHG) in each process of MSW management is expected to accelerate climate change (Hay, 2000). On the other hand, climate change is observed as one of the drivers of MSW generation and management. For instance, the increased temperature can alter the decomposition rates of different compounds in the MSW, flooding may create large amounts of household waste in municipalities and heat waves may exacerbate the amount of dust. Similarly, Erratic monsoons might increase the risk of flooding and erosion reinforcing the above-mentioned effects.
This research attempts to understand the second part of the relationship i.e. the effects of climate change on MSW in the context of Nepal. Nepal- a geographically diverse nation in South Asia- is one of the top ten vulnerable nations to climate change in the globe. Situated at the lap of the Himalayas, glacial retreats, droughts, flash floods, and surging temperatures have become common issues in the country. This has posed a serious threat to the 276 municipalities, eleven sub-metropolitan, and five metropolitan cities located in the country in different ways. Out of all, SWM is a crucial issue. According to the Waste Management Baseline Survey of Nepal 2020, around 2232.7 metric tons of solid waste was collected in Nepal in the year 2018 which increased from 2017 by 68.3 metric tons which is expected to rise in the coming years. Amidst contemporary policies on SWM, climate change can be a determining variable in shaping the generation and management of solid waste in the coming years motivating the researcher to study the issue.
Using MSW data from the baseline survey and climate data from NASA Langley Research Center(LaRC) POWER Project, this article estimates the average and disaggregated effects of climatic conditions on MSW with the help of a logarithmic cross-sectional regression model with region-fixed effects. It is found that both average temperature and total precipitation are negatively related to the MSW while the lag weather conditions are positively associated with it. Out of different sources of waste, household wastes are found sensitive to the general climatic conditions while no effects are observed on MSW differentiated by their types. Although limited by the range of data, this study provides strong policy recommendations with regard to the inclusion of climate change discourse in MSW management. Further work on the subject with rich data, cross-country lens, and innovative theoretical framework and empirical methodologies is recommended.
This article is divided into the following sections. First, the Literature Review section provides a summary of relevant theoretical frameworks and empirical studies on the subject. Second, the Empirical Model section highlights the econometric specification used in this article along with the definitions of the variables. Third, the Data section provides a short introduction to the data source, descriptive statistics of relevant variables, and essential Exploratory Data Analysis (EDA). Fourth, the Results section provides the empirical results with average and disaggregated effects based on the sources and types of waste. Fifth, the Discussion section provides explanations, implications, and limitations of the results. Then, the Conclusion section sums up the article followed by the Limitations and the way forward section.
II. Literature Review
Although the literature on Municipal Solid Waste (MSW) generation mechanisms and predictive models has proliferated recently, studies considering the impact of climatic variables are sparse. Generally, MSW generation models have usually considered three different categories of independent variables based on the product life cycle (Beigl et al., 2008). These include factors related to production and trade, consumption, and disposal. Firstly, some of the factors related to production and trade consist of price per product unit for each industry, residence time i.e. the duration of the use phase of a particular product among others.
Secondly, consumption-related factors include variables such as population, income level, and dwelling unit size (Dyson & Chang, 2005; Ojeda-Benitez et al., 2008). For instance, a study by Rukundo & Ariho (2022) suggests an increment in solid waste accumulation with a high birth rate and immigration. Similarly, the urban population was found to be one of the significant explanatory factors in MSW production in different provinces of China as predicted by six different machine-learning techniques (Yang et al., 2021). Besides, private consumption expenditures by different product groups, household size, age structure, employment status, life expectancy, infant mortality rate, life-cycle stage of the households, and consumption habits are found to be significant variables in this regard (Beigl et al., 2008).
Last, home heating arrangement, fostered recycling activities, container size, collection site density, and user fees are some of the important variables in the disposal category. A study by Chu et al. (2016) finds a significant correlation between the quantity of solid waste transport vehicles, the rate of harmless treatment, and the collection area of solid waste each with the MSW generation. In the same way, many studies have studied extensively the impact of user fees on the MSW generation including the classic study by Jenkins (1993). Another study by Hong (1999) carried out using Korean household survey data indicates an increase in the recycling of waste with the rise in the waste collection fee. Similar conclusions have been drawn by Wu et al. (2015) in the case of China.
A good deal of variation in MSW can be explained by factors in these different categories. However, it has become a necessity to incorporate climatic variables in the SWM generation and prediction models as they significantly affect them ranging from production and consumption to disposal (Bebb, 2003). Studies in this respect are varied in terms of methodology, geographical coverage, findings, and relevance.
A case study by Dayal et al. (1993) studied the impact of climatic factors on solid waste in Agra city during 1989-90. Four hundred and fifty samples collected using Stratified Random Sampling were analyzed where the climatic conditions were found to affect waste characteristics such as pH, moisture content, and organic matter significantly. In the same way, Abdoli et al. (2011) use a multivariate regression model to estimate the effects of different factors including climate on solid waste production in Mashhad, Iran. The model predicted a 0.103 percent significant increase in solid waste generation with an increment in the maximum temperature by one percentage. Change in temperature is hypothesized to cause changes in the consumption patterns of households thereby changing solid waste production.
Similarly, Abdoli et al. (2012) propose long-term forecasting of solid waste generation with the application of Artificial Neural Networks(ANN). The generated solid waste is simulated using different ANN models using monthly time series datasets in 2000-2010 for the city of Mashhad Iran. The effect of maximum temperature on solid waste generation was found greater i.e. 0.14 percent than that of the previous model. Also, Azadi & Karimi-Jashni (2016) found a significant correlation between seasonal municipal solid waste generation and a maximum temperature of 0.48 in their study of solid waste generation through ANN and other approaches in Fars province, Iran. The maximum temperature is considered to capture the variation in solid waste generation across seasons as they speculate large differences in solid waste generation in different seasons of the year.
In contrast, a more recent study on yard waste generation models using ANN by Vu et al. (2019) carried out in Austin, Texas shows dis-similar results. A significant negative correlation of -0.225 between Yard Waste and Average Temperature is found. The inverse relationship between temperature and yard waste is attributed to the nature of municipal yard waste in the US. Higher temperature promotes the evaporation of moisture in the yard waste mostly consisting of grass thereby reducing the waste’s weight. In the case of precipitation, the correlation is also negative with a magnitude of 0.047. This has been explained by the fact that high rainfall acts as a natural cleaning agent and thereby reduces the amount of solid waste generation. But the association between Yard Waste and Maximum Wind Speed is positive with a magnitude of 0.322. Higher wind speed can destroy trees and other natural and artificial objects leading to an increase in solid waste.
With an application of a gradient boosting regression model on New York City Department of Sanitation (DSNY) waste collection data from July 2003 to January 2015, Johnson et al. (2017) find temperature as the most significant feature for both spatial and Spatio-temporal models while precipitation is ranked fifth. As temperature contains high-frequency time-scale information capturing weekly deviations along with seasonal variation in solid waste generation, this might explain the substantial effect of temperature.
In the context of Nepal, few studies have investigated the process of municipal solid waste generation. One of the studies by Pathak et al. (2020) analyzed the MSW from 60 municipalities in Nepal covering 3300 households, 600 institutions, and 600 commercial establishments. Solid waste generation is found significantly influenced by the size of the municipal population, geographical location, household expenditure, and degree of urbanization. A recent study by Khadka et al. (2021) samples 288 families from the 32 wards of Kathmandu Metropolitan City (KMC) with the aid of stratified sampling. They find the household size and income as positively significant variables in waste generation.
Out of all, a majority of studies are found to have concentrated on only the Kathmandu Metropolitan City (KMC) and are of descriptive nature with simple correlation analysis (Alam et al., 2008; Dangi et al., 2011; Khadka et al., 2021). Having said that, similar studies have also studied the phenomenon in other parts of the country but are almost negligible. For example, using cluster sampling techniques, Dangi et al. (2013) examined household solid waste and survey management practices for hundred Tulsipur Municipality households. It is found that the general composition of solid waste comprises a greater portion of organic waste including a significant amount of dirt and hazardous wastes. Dahal & Adhikari (2018) did a similar study for Jeetpur Simara sub-metropolitan city using a random structured questionnaire survey and found the presence of eighty percent of organic materials in solid waste as previous research showed.
No literature can be found on the relationship between MSW and climate change in the context of Nepal. The key variables considered in most of the studies in Nepal have been socio-economic in nature while the discourse on the effect of climate change on solid waste generation and management equals none. Moreover, no consensus can be found on the association of key climate variables like temperature and precipitation on MSW as discussed above.
Thus, this study fulfills this gap on two fronts. First, it provides a piece of new evidence on the effect of climatic conditions on solid waste management in the global literature. Second, it provides a nationwide status of MSW of different municipalities in Nepal and also the drivers of solid waste generation and management. Further, this will be the first study to infer the effects of temperature and precipitation in MSW.
III. EMPIRICAL MODEL
The logarithmic solid waste generation model as employed by Abdoli et al. (2011) with slight modifications is used to estimate the impact of climate change on the municipal SWM through Ordinary Least Squares (OLS). Modifications include the inclusion of other relevant variables (no of wards, region fixed effects), the use of proxies for important variables of interest (municipal budget for real income of municipality, municipal density for population and area), and usage of lags to prevent the omitted variable bias. We estimate the parameters of the cross-section regression model with district fixed effects given by,
(1) Yit = βo+β1Ti,t + β2Pi,t + β3Ti,t-1+ β4Pi,t-1+ β5 Xi,t + ui,t
Table 1: Definition of the variables used in the model
| SN | Variables | Definition |
|---|---|---|
| 1 | Yi,t | Log total solid waste generated by a municipality in a particular year in a metric ton |
| 2 | Ti,t | Average temperature in a municipality in a particular year in degrees celsius |
| 3 | Pi,t | Total precipitation in municipality in a particular year in mm |
| 4 | Ti,t-1 | Lag of average temperature |
| 5 | Pi,t-1 | Lag of total precipitation |
| 6 | Xi,t | Vector of Municipal controls |
| i) | Number of wards | |
| ii) | Municipality density in kilometer square | |
| iii) | Average household size | |
| ivy | Municipality budget of a particular year in ‘000’ rupees | |
| v) | Lag of Municipality budget | |
| vi) | Region fixed effects |
IV. DATA
Solid waste management data from a baseline survey (Pathak, 2017) is used in this study. Disaggregated data on municipal solid waste management is made available along with different municipal characteristics for 60 municipalities of Nepal. The data on solid waste was collected from 3330 households, 600 institutions, and 600 commercial establishments via random sampling. Further, municipality-level characteristics were collected through separate sets of questionnaires.
Likewise, climate data are obtained from the NASA Langley Research Center(LaRC)
POWER Project funded through the NASA Earth Science/Applied Science Program
and extracted using NASA’s power access API. The dataset contains information on 18 weather variables extracted from 93 weather stations spanning 62 districts in Nepal with respect to meteorological stations in Nepal from 1981-01-01 to 2019-12-31. Out of all, two variables i.e. Temperature at 2 Meters in degrees celsius and Precipitation in mm per day are used in this research. The values of the variables are taken for the year of the baseline survey mentioned above i.e. 2016. Lags of weather variables for 2015 are taken in the same manner. Finally, the MSW baseline survey data was merged with the climate data on the basis of districts where the municipalities were located.
A. Summary Statistics
Table 2 provides the summary statistics for important MSW and climate variables of 60 municipalities used for the research. The mean estimated MSW is almost seven tons while the mean average temperature in 2016 is around 12.73 degrees Celsius. In the same way, the mean total precipitation in 2016 is around 47 mm per day.
Table 2: Summary Statistics of key Variables
| Mean | Std. Dev. | Median | max | min | skewness | kurtosis | |
|---|---|---|---|---|---|---|---|
| Average household size | 5.2 | .777 | 5.000 | 7 | 4 | .079 | 2.444 |
| Municipality density | 355.44 | 256.909 | 282.000 | 1676 | 64 | 2.89 | 14.406 |
| Number of wards | 12.217 | 2.713 | 12.000 | 19 | 6 | .565 | 3.122 |
| Total estimated msw(ton) | 6.991 | 4.505 | 5.260 | 18.91 | 1.57 | 1.048 | 3.095 |
| Log per capita msw | 1.749 | .638 | 1.660 | 2.94 | .451 | -.004 | 2.404 |
| Municipal budget 2015 | 30213.95 | 57358.699 | 2300.000 | 409080 | 0 | 4.924 | 32.911 |
| Municipal budget 2016 | 39654.683 | 49907.642 | 32198.000 | 300000 | 0 | 2.618 | 13.566 |
| Average temperature 2016 | 12.73 | 6.802 | 13.906 | 21.367 | -9.801 | -.977 | 3.578 |
| Average temperature 2015 | 11.284 | 7.026 | 12.386 | 20.01 | -12.747 | -1.115 | 4.018 |
| Total precipitation 2016 | 47.172 | 12.137 | 45.470 | 67.15 | 19.57 | -.276 | 2.654 |
| Total precipitation 2015 | 155.96 | 68.478 | 169.390 | 253.3 | 28.77 | -.223 | 1.531 |
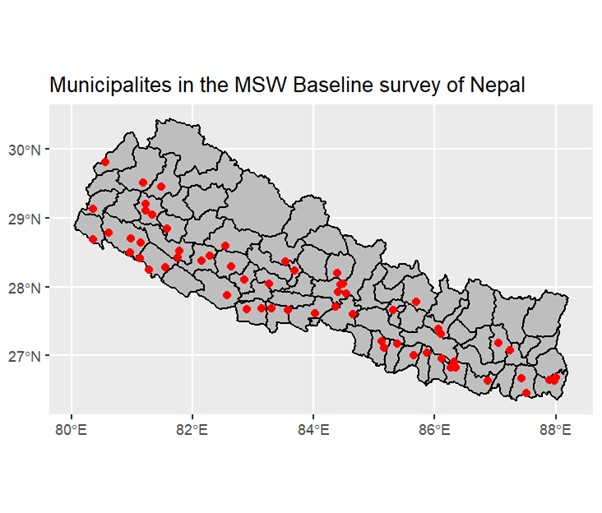
The distribution of municipalities in the baseline survey can be categorized across the different regions of Nepal as given in Table 3. Terai includes the largest number of municipalities (30) followed by Hill (28) and Mountain (2). Further, the GIS map of the spatial distribution of municipalities is also provided in Appendix A.
Table 3: Distribution of municipalities across regions.
| Freq. | Percent | Cum. | |
|---|---|---|---|
| Mountain | 2 | 3.33 | 3.33 |
| Hill | 28 | 46.67 | 50 |
| Terai | 30 | 50 | 100 |
| Total | 60 | 100 |
a. Municipal Solid Waste (MSW) data
Figure 1 provides the histogram of total MSW generated per day in the municipalities of Nepal. The histogram is fairly right-skewed with a skewness of 1.05 which becomes somewhat symmetrical after the log transformation given in Figure 2.
Figure 1: Histogram of Total MSW generated per day
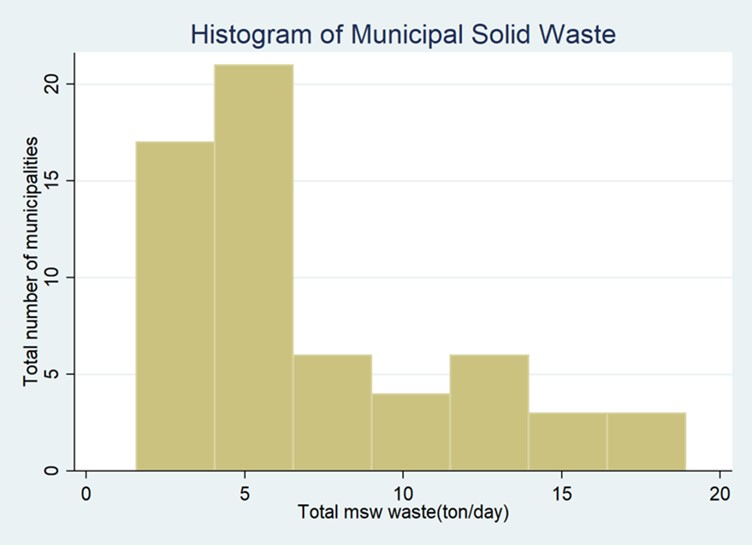
Figure 2: Histogram of Log Total MSW generated per day
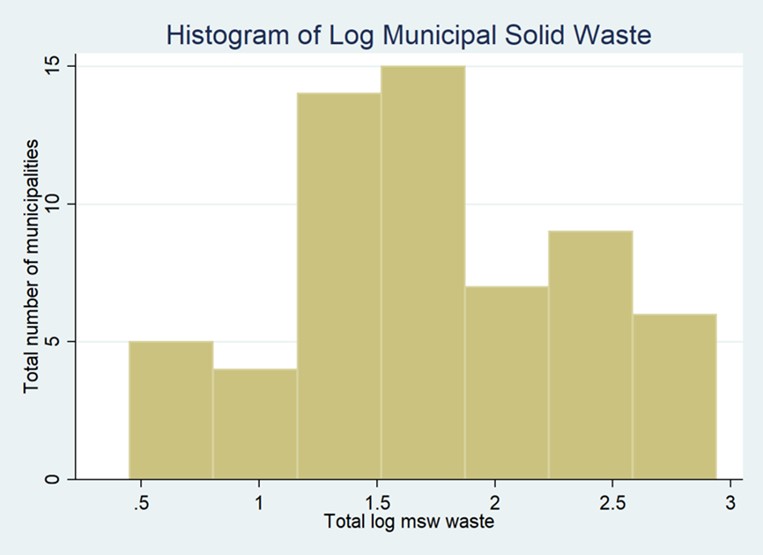
Table 3 provides the descriptive statistics of MSW by sources and types. For example, under the sources of waste, the mean household waste per day is 4.408 tons in a municipality while that of institutional and commercial are 0.233 and 1.648 tons respectively. In the same way, the types of waste include Organic waste, Plastic waste, Paper waste, Glass waste, Metals waste, textile waste, Rubber Leather waste, and Other waste. As observed with the skewness in the table, all sources and types of waste are not symmetrical– most of them being positively skewed. It demands a logarithmic transformation carried out later for the disaggregated regression analysis.
Table 4: Summary Statistics of sources and types of wastes
| Sources and types of wastes | Mean | Std. Dev. | Median | max | min | skewness | kurtosis |
|---|---|---|---|---|---|---|---|
| Household waste(ton) | 4.41 | 2.652 | 3.39 | 11.34 | 1.1 | 0.984 | 2.967 |
| Institutional waste(ton) | 0.23 | 0.165 | 0.18 | 0.85 | 0.05 | 1.896 | 6.481 |
| Commercial waste(ton) | 1.65 | 1.473 | 1.27 | 6.72 | 0.21 | 1.67 | 5.493 |
| Organic waste composition | 60.4 | 11.238 | 62 | 79.99 | 36.25 | -0.431 | 2.194 |
| Plastic waste composition | 12.4 | 4.783 | 11.8 | 23.68 | 4.94 | 0.543 | 2.606 |
| Paper waste composition | 11 | 4.797 | 10.4 | 23.61 | 2.34 | 0.546 | 2.872 |
| Glass waste compostition | 6.2 | 5.722 | 3.92 | 28.29 | 0 | 1.465 | 5.475 |
| Metals waste composition | 1.56 | 1.684 | 1 | 6.54 | 0 | 1.287 | 3.785 |
| Textiles waste composition | 1.64 | 1.603 | 1.04 | 7.88 | 1.276 | 5.099 | |
| Rubber Leather composition | 0.85 | 1.841 | 0.22 | 12.73 | 4.753 | 30.172 | |
| Other waste composition | 6 | 6.165 | 4.82 | 25.39 | 0 | 1.421 | 4.972 |
b. Climate data
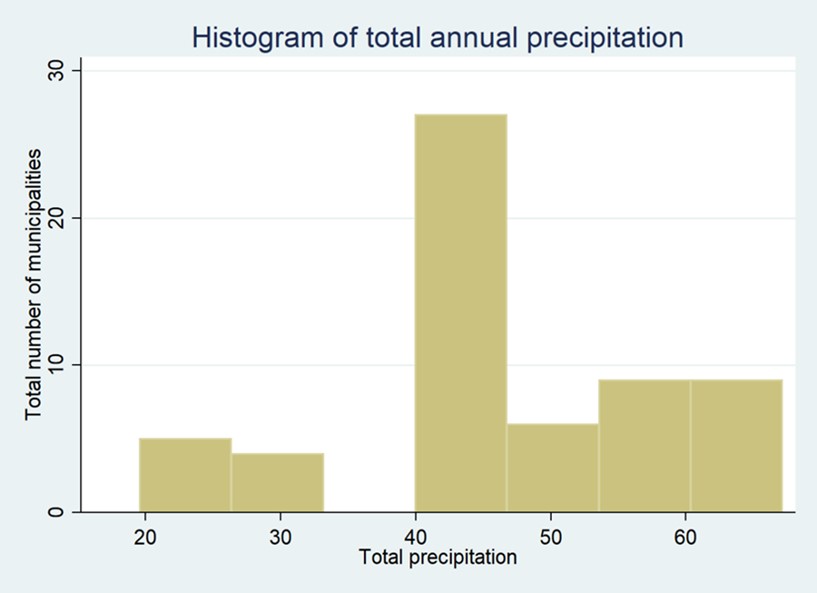
In the same way Figure 3 and Figure 4 provide histograms of average annual temperature and total precipitation respectively.
Figure 3: Histogram of average annual temperature
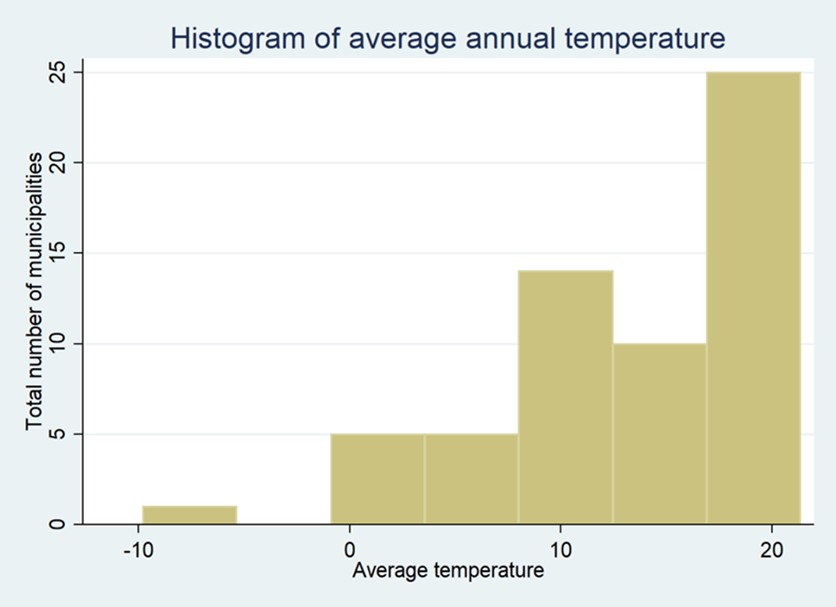
Figure 4: Histogram of total precipitation
V. RESULTS
The result section provides the average effect, disaggregation of effects by sources of wastes, and types of wastes as follows.
A. Average Effect
Table 3 provides the results of the estimation of the proposed model using OLS. Four different specifications from Model 1 to Model 4 have been estimated.
The first model regresses the Log total municipal solid waste on average temperature and total precipitation of 2016. The average temperature is significant at even a one percent level of significance suggesting a positive relationship with MSW. Precisely, one degree Celsius increment in Average temperature is found to increase the MSW by 3.52 percent. In contrast, Total Precipitation is negatively associated with MSW with a five percent level of significance. One mm increment in the total precipitation suggests a decrement of MSW by 1.43 percent.
Table 5: Average effect of climate variables on MSW
| Independent Variables | Model 1 | Model 2 | Model 3 | Model 4 |
|---|---|---|---|---|
| Average temperature 2016 | 0.0352*** (0.0113) |
0.105 (0.150) |
-0.0779 (0.141) |
-0.293** (0.130) |
| Total precipitation 2016 | -0.0143** (0.00633) |
-0.0174* (0.0103) |
-0.0240** (0.00976) |
-0.0154* (0.00863) |
| Average temperature 2015 | -0.0689 (-0.145) |
0.104 (-0.137) |
0.296** (-0.125) |
|
| Total precipitation 2015 | 0.000565 (0.00191) |
0.00205 (0.00190) |
0.00293* (0.00163) |
|
| No of wards | 0.0424* (-0.0242) |
0.0376* (-0.0209) |
||
| Municipality density | 0.00104*** (0.000270) |
0.000496* (0.000262) |
||
| Average household size | 0.231** (0.0942) |
0.103 (0.0860) |
||
| Municipality budget 2016 | 7.05e-07 (1.26e-06) |
5.65e-07 (1.08e-06) |
||
| Municipality budget 2015 | 1.35e-08 (1.12e-06) |
3.38e-07 (9.67e-07) |
||
| Constant | 1.975*** (-0.384) |
1.920*** (-0.483) |
0.261 (-0.688) |
0.97 (-0.667) |
| Observations | 60 | 60 | 60 | 60 |
| Adjusted R-squared | 0.2672 | 0.2489 | 0.4581 | 0.6033 |
| Region fixed effects | No | No | No | Yes |
Standard errors in parentheses
*** p<0.01, ** p<0.05, *p<0.1
We include the lag of both weather conditions in Model 2. The total precipitation of 2016 is only found significant at a ten percent level of significance. One mm increment in the total precipitation is linked with a 1.74 percent decrement in the MSW.
So as to control for the municipal level characteristics we include various variables such as the number of wards, Municipal density, Average household size, Municipality budget of 2016, and its lag in Model 3. The only significant weather variable in this model is the Total Precipitation of 2016 at a five percent level of significance. Here, one mm increment in the total precipitation decreases MSW by 2.4 percent. The significant municipal-level characteristics in this model are the number of wards, municipal density, and average household size.
Finally, Model 5 captures the geographic diversity of the municipalities using region-fixed effects. This leads to the significance of both weather variables and their lags. Particularly, the average temperature of 2016, which is significant at five percent, is negatively associated with the MSW unlike Model 1 as well as the current literature. One degree Celsius rise in the average temperature is found associated with the decrement of MSW by 29.3 percent. Similarly, the total precipitation of 2016 is also negatively significant at a one percent level of significance. One mm increase in total precipitation is associated with a 1.54 percent decrement in the MSW. Lag weather variables however have a positive significant relationship with the MSW.
The Adjusted R-squared has increased with a higher level of model specifications with an exception of Model 2. The adjusted R-squared of the final specification i.e. Model 4 is equal to 0.6033 suggesting that sixty percent of the total variation in the dependent variable is explained by the model.
B. Decomposition of effects by sources of wastes
Table 6 provides the disaggregated effects of weather conditions on MSW by their sources. The major waste sources include Household, Institutional, and Commercial waste.
Table 6: Disaggregated effects of climate variables on different sources of MSW
| Independent Variables | Log household waste | Log institutio- nal waste | Log commerc- ial waste |
|---|---|---|---|
| Average temperature 2016 | -0.252** (0.122) |
-0.236 (0.178) |
-0.278 (0.258) |
| Total precipitation 2016 | -0.0145* (0.00812) |
-0.0156 (0.0118) |
-0.0265 (0.0171) |
| Average temperature 2015 | 0.256** (0.118) |
0.223 (0.171) |
0.271 (0.248) |
| Total precipitation 2015 | 0.00248 (0.00154) |
0.00384* (0.00223) |
0.00484 (0.00324) |
| No of wards | 0.0315 (0.0196) |
0.0198 (0.0285) |
0.0248 (0.0414) |
| Municipality density | 0.000447* (0.000247) |
0.000421 (0.000358) |
0.000550 (0.000520) |
| Average household size | 0.102 (0.0809) |
0.126 (0.117) |
0.163 (0.171) |
| Municipality budget 2016 | 3.46e-07 (1.01e-06) |
-6.51e-07 (1.47e-06) |
-8.29e-07 (2.14e-06) |
| Municipality budget 2015 | 2.54e-07 (9.09e-07) |
-3.52e-07 (1.32e-06) |
1.38e-06 (1.92e-06) |
| Constant | 0.511 (0.627) |
-1.477 (0.910) |
-0.243 (1.322) |
| Observations | 60 | 60 | 60 |
| Adjusted R-squared Region fixed effects | 0.5959 Yes | 0.5492 Yes | 0.1424 Yes |
Standard errors in parentheses
*** p<0.01, ** p<0.05, *p<0.1
The adequate specification i.e. Model 4 is used where dependent variables are substituted by each source of waste as given in the table. Logarithmic transformation of MSW by different sources is carried out for ensuring the normality of the dependent variable.
Out of all the sources of waste, Household waste is observed to be significantly affected by climatic conditions while both Institutional and Commercial wastes are observed to be unresponsive to the average temperature and total precipitation.
Average temperature 2016 and Total Precipitation 2016 are negatively associated with the household MSW as predicted by Model 4. The former is significant at five percent while the second is at a one percent level of significance. To quantify, a one degree Celsius increment in the average temperature of 2016 leads to a 25.2 percent decrement in the household MSW and a one mm increase in the total precipitation of 2016 subdues household MSW by 1.45 percent. While not affected by the present weather conditions, the total precipitation of 2015 is found significant at 10 percent with the log institutional MSW.
C. Decomposition of effects by types of wastes
In the same way, Table 7 provides the disaggregated effects of weather conditions on different types of wastes. The different types of waste include Organic, Plastic, Paper, Glass, Metals, Textiles, Rubber, and Others. All types of MSW are transformed into logarithmic forms so as to make them symmetrical. As observed in the table, no present weather conditions are significant. Only the Total precipitation of 2015 is significant at a 10 percent level of significance with Log Textiles MSW. Having said that municipal-level characteristics such as household size and Municipal budget 2015 are significant as observed in the table below.
Table 7: Disaggregated effects of climate variables on different types of MSW
| Independent Variables | 1) Log Organic | (2) Log Plastic | (3) Log Paper | (4) Log Glass | Log Metals | Log Textiles | Log Rubber | Log Others |
|---|---|---|---|---|---|---|---|---|
| Average temperature 2016 | 0.0187 (0.0668) |
0.0909 (0.125) |
0.00169 (0.154) |
-0.525 (0.368) |
-0.705 (0.449) |
-0.145 (0.419) |
0.101 (0.472) |
-0.0670(0.502) |
| Total precipitation 2016 | 0.000190 (0.00444) |
0.00954 (0.00831) |
0.00367 (0.0102) |
-0.0223 (0.0237) |
-0.00642 (0.0284) |
0.0380 (0.0275) |
-0.0183 (0.0304) |
0.0117 (0.0267) |
| Average temperature 2015 | -0.0176 (0.0643) |
-0.0669 (0.120) |
-0.00735 (0.148) |
0.495 (0.354) |
0.726 (0.432) |
0.142 (0.401) |
-0.124 (0.456) |
0.00157 (0.478) |
| Total precipitation 2015 | 0.000648 (0.000840) |
-0.000468 (0.00157) |
-0.000384 (0.00193) |
0.00206 (0.00463) |
-0.000106 (0.00561) |
-0.00936* (0.00543) |
0.00229 (0.00608) |
0.00160 (0.00554) |
| No of wards | -0.00339 (0.0107) |
-0.0155
(0.0201) |
-0.0237 (0.0247) |
-0.0495 (0.0582) |
-0.0239 (0.0736) |
0.107 (0.0667) |
0.121 (0.0828) |
0.0204 (0.0656) |
| Municipality density | 6.11e-05 (0.000135) |
7.24e-05 (0.000253) |
2.28e-05 (0.000311) |
-0.000426 (0.000717) |
-0.000840 (0.000843) |
-0.000835 (0.000753) |
-0.000584 (0.00169) |
-0.000836 (0.000733) |
| Average household size | 0.00778 (0.0442) |
-0.106 (0.0828) |
-0.0787 (0.102) |
0.111 (0.239) |
0.0174 (0.283) |
0.376 (0.269) |
-0.637* (0.342) |
-0.131 (0.247) |
| Municipality budget 2016 | 1.81e-07 (5.54e-07) |
-1.10c-06 (1.04e-06) |
-1.63e-06 (1.28c-06) |
2.51c-06 (3.22e-06) |
-3.30c-06 (3.50e-06) |
1.25c-06 (3.15e-06) |
-1.73c-06 (4.400-06) |
-2.610-06 (3.06c-06) |
| Municipality budget 2015 | -5.540-07 (4.97e-07) |
9.90€-07 (9.30-07) |
1.28e-06 (1.14e-06) |
1.01-05* (5.82e-06) |
3.43c-06 (3.15e-06) |
-2.89e-06 (2.78e-06) |
2.50c-05*** (8.54c-06) |
3.18e-06 (2.73e-06) |
| Constant | 3.812*** (0.343) |
2.467*** (0.642) |
3.217*** (0.789) |
3.831** (1.885) |
1.218 (2.323) |
-2.693 (2.030) |
0.989 (2.489) |
-1.744 (2.273) |
| Observations | 60 | 60 | 60 | 57 | 53 | 52 | 38 | 50 |
| R-squared | -0.0672 | 0.0695 | 0.0021 | 0.0898 | 0.1046 | 0.0888 | 0.0925 | 0.1167 |
| Region fixed effects | Yes | Yes | Yes | Yes | Yes | Yes | Yes | Yes |
VI. DISCUSSION
This paper examines the association between MSW and weather shocks in the context of Nepal. Not only the overall effect but also the disaggregated effects of weather conditions on MSW based on their types and sources are estimated. Thus, the marginal response of the MSW to average temperature and total precipitation are computed as discussed in detail in the previous section.
This research generates five pertinent findings. Firstly, the temperature of the current year is found negatively related to the MSW, unlike the literature on the subject. Secondly, total precipitation standing with the past studies is negatively linked with MSW. Thirdly, both average temperature and total precipitation of the previous year are positively associated with the MSW. Fourthly, weather conditions behave similarly with respect to the household MSW while having no effect in context to other sources of waste. Finally, no impact of climatic variables can be traced for different types of waste. This section is further divided into the following subsections for further exploration of the results.
A. Explanation
First of all, the negative relationship between the current year’s temperature and MSW is quite puzzling. It suggests that municipalities with higher temperatures in the current year have lower MSW ceteris paribus. One possible explanation for this phenomenon could be the increased decomposition rates of solid waste in higher temperatures. As solid waste decomposes and desiccates quickly in greater temperatures, households might prefer to process them manually in their house. On one hand, the solid waste of Nepalese households consists of around 66 percent of organic waste (Asian Development Bank, 2013) which decomposes easily. On the other hand, domestically decomposed solid waste can be used as organic manure in various agricultural endeavors. This may reduce the quantity of solid waste, households opt to dispose of it as MSW thereby decreasing MSW.
In contrast, the inverse association between the current year’s total precipitation and MSW is fairly straightforward. The pathway of the effect can be explained by the cleansing role of rain. In places of higher rain, solid waste collected in different containers at home or open places in the community gets washed up thereby decreasing its quantity.
Next, the direct effects of lag weather conditions i.e. average temperature and precipitation can have extended pathways and many intervening variables due to their lag nature. In other words, their effect on MSW of commencing year has to depend on other mechanisms including consumption, income, population, employment, technology, and so on.
Fourthly, the effect of weather conditions only on household waste but not on institutional and commercial ones is intuitive. As household MSW comprises a large proportion of organic waste matter and forms one of the greatest shares of the total MSW, exposure to the effect of climate variables follows. Generally, institutional and commercial MSW are less organic in nature, thus the magnitude of the effect is negligible as observed in the results. Lastly, the nature of the result observed with regard to the effects of weather conditions on various types of wastes can be attributed to the low sample size and requires a rich and complete data set for meaningful interpretation.
B. Implications
Above all, the findings suggest a holistic adaptation of SWM to climate change. The ideas on the ramifications of climate change are nascent and naive in the context of Nepalese Society. Although a few urban middle-class people may be aware with regard to the physical consequences of climate change ranging from global warming, increase in the sea level, bursting of the glacial lakes, and so on, knowledge of its socio-economic consequences is minimal. The socioeconomic impacts of climate change vary, ranging from agricultural productivity, inequality, and child marriage– MSW being one of them. Thus, it is of prominent importance to enhance the awareness of all citizens of the country from every municipality on the subject of climate change and its impacts extending up to MSW. For this, the government should integrate the issue of climate change in every MSW policy and related existing and new activities. Similarly, the role of the media is crucial in this regard. Some of the effective strategies include Multimedia campaigns, workshops, and training including the integration of climate awareness and its effects on SWM into the basic education curriculum.
In particular, crucial municipality, national, and global scale implications can be drawn out from this research. In the short term, specific policies can be targeted to the vulnerable municipalities which include ones with relatively lower average temperatures and low precipitation at different levels. On one hand, the exposed municipalities can design customized policies to incorporate climate change into SWM and execute accordingly. Climate change-resilient SWM infrastructures and processes along with informed human resources can be pivotal in minimizing the burden. On the other hand, the national and federal government can assist them with targeted funds, and national priorities to adapt and lastly mitigate the adverse impacts.
Solving this issue also becomes a global imperative due to the transboundary nature of climate change. Nepal, which plays a minor role in climate change, is bearing one of the greatest burdens. Hence, it becomes a moral commitment of developed nations to cooperate and collaborate in the combat against climate change and its risks including that of SWM. Quick adaptation of renewable energy, technology for improved energy efficiency in buildings, industry, and household appliances, technology for the reduction of CO2 emissions, etc is vital to curb the associated risks with climate change on a global scale. The agreement among global powers to curb the consequences due to climate change becomes crucial here. Furthermore, assisting developing and poor nations to overcome the risks via various financial and technical aid is a prerequisite.
VII. Conclusion
Management of MSW is a complicated issue for municipalities all around the globe. Developing nations, like Nepal, encounter additional bottlenecks in this context. Further, climate change has become a predominant factor in shaping the generation and management of MSW with due consideration of the vulnerabilities they face. Adding to the current literature on the subject, this study provides a piece of new evidence on the impact of climatic conditions on MSW in Nepal. Current year average temperature and total precipitation are observed negatively related to the MSW while that of the past year are positively linked. This suggests rapid adaptation of MSW with respect to climate change and its impacts at all levels.
VIII. Limitations and the way forward
The results of this research are subject to their own limitations. Firstly the baseline survey data used on MSW is quite limited to making a robust inference. Cross-sectional data on only sixty municipalities make the results sensitive. Moreover, the specified models require more municipal-level characteristics ranging from employment, income, consumption, and so on all in the disaggregated form to make causal inferences on the impact of climatic conditions on MSW. Further, the pathway of effect from climate change to MSW is still unclear and requires further theoretical work to make a strong case. The causality can be bidirectional and hence requires sophisticated econometric techniques with non-linear climate impacts to reveal the desired associations and inferences.
In context to climate data, important variables such as natural disasters and their magnitude, and extreme weather events are not incorporated in the research due to data unavailability. Municipal-level instead of District level climate data could have generated more precise results in this regard.
Advancements in this research can be made on three fronts- data, theoretical framework, and empirical methodologies. Rich and disaggregated data on MSW and municipal-level characteristics is a must. Similarly, municipality-level climate data with additional variables mentioned above will be crucial in strengthening the estimators and inferences. Next, an elaborate review of existing theories and the development of a comprehensive theoretical framework of the climatic impacts on MSW is the need of the hour. Finally, cutting-edge empirical methodologies including machine learning and causal inference able to capture the dynamic and non-linear impacts of climate on MSW are necessary to make the desired progress in this research field.
Although this area of research is in its infancy, insights on the topic have myriad policy significance and implications. This demand concerted efforts from researchers around the globe for diverse disaggregated and cross-country studies using novel methodologies.
IX. REFERENCES
Abdoli, Mohammad A., Maliheh Falahnezhad, and Sadegh Behboudian. 2011. “Multivariate Econometric Approach for Solid Waste Generation Modeling: Impact of Climate Factors.” ENVIRONMENTAL ENGINEERING SCIENCE 28 (9): 627–633. doi:10.1089/ees.2010.0234.
Abdoli, Mohammad A., Maliheh F. Nezhad, Reza S. Sede, and Sadegh Behboudian. 2012. “Longterm Forecasting of Solid Waste Generation by the Artificial Neural Networks.” Environmental Progress & Sustainable Energy 31 (4). http://dx.doi.org/10.1002/ep.10591.
Alam, R., M.A.I Chowdhury, G.M.J. Hasan, B. Karanjit, and L. R. Shrestha. 2008. “Generation, storage, collection and transportation of municipal solid waste – A case study in the city of Kathmandu, capital of Nepal.” Waste Management 28:1088–1097. https://doi.org/10.1016/j.wasman.2006.12.024.
Asian Development Bank. 2013. Solid Waste Management in Nepal: Current Status and Policy Recommendations. N.p.: Asian Development Bank.
Azadi, S., and A. Karimi-Jashni. 2016. “Verifying the performance of artificial neural network and multiple linear regression in predicting the mean seasonal municipal solid waste generation rate: A case study of Fars province, Iran.” Waste Management 488:14-23. https://doi.org/10.1016/j.wasman.2015.09.034.
Bebb, Jonathan. 2003. Potential Impacts of Climate Change on Waste Management. N.p.: Environment Agency.
Beigl, Peter, S. Lebersorger, and Stefan Salhofer. 2008. “Modelling municipal solid waste generation: A review.” Waste management 28 (1): 200-14. http://dx.doi.org/10.1016/j.wasman.2006.12.011.
Chu, Zhujie, Yunga Wu, An Zhou, and Wei Chiao. 2016. “Analysis of influence factors on municipal solid waste generation based on the multivariable adjustment.” Environmental Progress & Sustainable Energy 35 (6): 1629–1633. doi:10.1002/ep.12399.
Dahal, Y., and B. Adhikari. 2018. “Characterization and Quantification of Municipal Solid Waste in Jeetpur Simara Sub- Metropolitan City, Nepal.” Hydro Nepal: Journal of Water, Energy and Environment 22:45-47. https://doi.org/10.3126/hn.v22i0.18996.
Dangi, Mohan B., Christopher R. Pretz, Michael A. Urynowicz, Kenneth G. Gerow, and J. M. Reddy. 2011. “Municipal solid waste generation in Kathmandu, Nepal.” Journal of Environmental Management 92 (1): 240-249. https://doi.org/10.1016/j.jenvman.2010.09.005.
Dangi, Mohan B., Michael A. Urynowicz, and Shashidhar Belbase. 2013. “Characterization, generation, and management of household solid waste in Tulsipur, Nepal.” Habitat International 40:65-72. https://doi.org/10.1016/j.habitatint.2013.02.005.
Dayal, Gopal, Alka Yadav, R. P. Singh, and R. Upadhyay. 1993. “Impact of climatic conditions and socio-economic status on solid waste characteristics: a case study.” The Science of the Total Environment 136 (1-2): 143-153. https://doi.org/10.1016/0048-9697(93)90304-O.
Dyson, Brian, and Ni-Bin Chang. 2005. “Forecasting municipal solid waste generation in a fast-growing urban region with system dynamics modeling.” Waste Management 25 (7): 669-79. https://doi.org/10.1016/j.wasman.2004.10.005.
Hay, John E. 2000. GHG Inventories in PICCAP Countries: Evaluation and Regional Synthesis of National Greenhouse Gas Inventories: General Assessment and Regional Synthesis. N.p.: South Pacific Regional Environment Programme.
Hong, Seonghoon. 1999. “The effects of unit pricing system upon household solid waste management: The Korean experience.” Journal of Environmental Management 57 (1): 1-10. https://doi.org/10.1006/jema.1999.0286.
Jenkins, Robin R. 1993. The Economics of Solid Waste Reduction: The Impact of User Fees. N.p.: E. Elgar.
Johnson, Nicholas E., Olga Laniuk, Daniel Cazap, Linglan Liu, Daniel Starobin, Gregory Dobler, and Masoud Ghandehari. 2017. “Patterns of waste generation: A gradient boosting model for short-term waste prediction in New York City.” Waste Management 62:3-11. doi:10.1016/j.wasman.2017.01.037.
Khadka, Raju, Majeed Safa, Alison Bailey, Birendra KC, and Raju Poudel. 2021. “Factors Influencing Municipal Solid Waste Generation and Composition in Kathmandu Metropolitan City, Nepal.” International Journal of Scientific and Research PublicationsInternational Journal of Scientific and Research Publications 11 (1): 2250-3153. 10.29322/IJSRP.11.01.2021.p10961.
Ojeda-Benitez, Sara, Gabriela Lozano-Olvera, Raul Morelos, and Carolina A. de Vega. 2008. “Mathematical modeling to predict residential solid waste generation.” Waste Management 28 (supp-S1): 7-13. Sara Ojeda Benítez; Gabriela Lozano-Olvera; Raúl Adalberto Morelos; Carolina Armijo de Vega (2008). Mathematical modeling to predict residential solid waste generation. , 28(supp-S1), 0–0. doi:10.1016/j.wasman.2008.03.020.
Pathak, Dhundi R. 2017. “Solid Waste Management Baseline Study of 60 New Municipalities.” Kathmandu: Government of Nepal, Solid Waste Management Technical Support Centre (SWMTSC).
Pathak, Dhundi R., Bandita Mainali, Hossam A. Naga, Micheal Angove, and Ing Kong. 2020. “Quantification and characterization of the municipal solid waste for sustainable waste management in newly formed municipalities of Nepal.” Waste Management & Research 38 (9): 1007-1018. https://doi.org/10.1177/0734242X20922588.
Paulauskaite-Taraseviciene, A., V. Raudonis, and K. Sutiene. 2022. “Forecasting municipal solid waste in Lithuania by incorporating socioeconomic and geographical factors.” Waste management 140:31-39. https://doi.org/10.1016/j.wasman.2022.01.004.
Pope, Daniel H., Heather Mcmullen, Angela Baschieri, Anandita Philipose, Chiagozie Udeh, Julie Diallo, and David McCoy. 2022. “What is the current evidence for the relationship between the climate and environmental crises and child marriage? A scoping review.” Global Public Health. 10.1080/17441692.2022.2095655.
Rukundo, Isaac, and Pius Ariho. 2022. “A Mathematical Model of Solid Waste Accumulation and Treatment with a Varying Human Population Size.” Biomath Communications 9. 10.55630/bmc.2022.03.238.
Sengar, Rakesh S., and Kalpana Sengar, eds. 2017. Climate Change Effect on Crop Productivity. N.p.: CRC Press.
Singer, Merrill. 2018. Climate Change and Social Inequality: The Health and Social Costs of Global Warming. N.p.: Taylor & Francis Group.
Vu, Hoang L., Kelvin T. Wai Ng, and Damien Bolingbroke. 2019. “Time-lagged effects of weekly climatic and socio-economic factors on ANN municipal yard waste prediction models.” Waste Management 84:129-140. https://doi.org/10.1016/j.wasman.2018.11.038.
Wu, Jian, Weiqian Zhang, Jiaxuan Xu, and Yue Che. 2015. “A quantitative analysis of municipal solid waste disposal charges in China.” Environmental Monitoring and Assessment 187 (60). https://doi.org/10.1007/s10661-015-4305-0.
Yang, Liping, Yigang Zhao, Xiaxia Niu, Zisheng Song, Qingxian Gao, and Jun Wu. 2021. “Municipal Solid Waste Forecasting in China Based on Machine Learning Models.” Front. Energy Res 9 (763977). 10.3389/fenrg.2021.763977.
Yao, Lisa, Frank Van Woerden, Silpa Kaza, and Perinaz Bhada-Tata. 2018. What a Waste 2.0: A Global Snapshot of Solid Waste Management to 2050. N.p.: World Bank Publications.
X. Appendix A