Volume 35: Paper 1
The Effects of Nursing Shortages on Wages, Working Hours, and Employment during the COVID-19 Pandemic
Yusuke Fukase
Keio University
Nursing shortages have been a serious issue in Japan, and the COVID-19 pandemic likely exacerbated the problem by increasing the workload of nurses and raising the risk of burnout. Because nurses play a crucial role in hospital care in Japan’s aging society, understanding how nursing shortages during the pandemic affected nurses’ wages, working hours, and employment is important for designing policies to address persistent shortages. In particular, wage-setting behavior by medical institutions in response to a demand shock is important because it reveals labor market mechanisms that inform policy design.
The characteristics of the nursing labor market, whether it is monopsonistic or perfectly competitive, have been debated for more than 50 years, yet there is no consensus. Identifying these characteristics requires evidence on how medical institutions adjust wages and staffing following a demand shock. However, empirical evidence on the effects of the COVID-19 shock on nurses’ wages and employment, and on whether the responses differ by the degree of market concentration remains limited.
This paper examines how nursing shortages affect nurses’ earnings, working hours, and employment, and whether these effects vary with labor-market concentration. I construct a prefecture-gender-year panel dataset from 2010 to 2023 by merging government statistics, data from the Japan Medical Association, and medical claims data provided by Japan System Techniques Co., Ltd. (JAST). I measure nursing shortages using two proxies: the job openings-to-applicants ratio and one minus the share of medical institutions that adopted the 7-to-1 patient-to-nurse staffing ratio in 2019. Labor-market concentration is captured by the Herfindahl-Hirschman Index (HHI), which is computed from the distribution of general beds across hospitals in each secondary medical area. HHI ranges from 0 to 1, with higher values indicating greater concentration. I compare effects between high-HHI and low-HHI prefectures. The paper estimates two-way fixed effects models with prefecture, gender, and year fixed effects, along with prefecture-specific and gender-specific linear time trends. It also implements event-study specifications to examine the dynamic effects and assess pre-trends.
This research contributes in three ways. First, it provides new evidence on whether Japan’s nursing labor market is closer to employer monopsony or perfect competition by exploiting the COVID-19 period as an exogenous shock and allowing effects to differ by market concentration. This is relevant to Japan’s national policies introduced in 2022 to raise nursing wages, whose effectiveness depends on the extent of employer monopsony power. Second, it documents how registered nurses’ wages, working hours, and employment responded during the pandemic. Third, it examines whether the patient-care capacity of medical institutions captured by the 7-to-1 patient-to-nurse staffing ratio, is associated with wage and labor-market outcomes during the COVID-19 period.
I. Background
A. Labor Shortages of Nurses
Registered nurses in Japan numbered 1.32 million in 2020, which gradually increased from 0.42 million nurses in 1990 (Ministry of Health, Labour, and Welfare, Medical Affairs Bureau, Nursing Department, 2023). Despite this growth, it is predicted that excess demand for nurses will cause persistent shortages. The demand for nurses in 2025 is estimated to reach between 1.88 and 2.02 million, whereas the supply of nurses is projected to remain between 1.75 and 1.82 million (MHLW, Medical Affairs Bureau, Nursing Department, 2019). This forecast implies a shortfall. Consistent with a tight labor market, the job openings-to-applicants ratio for nurses was 2.20 in 2022, compared with 1.19 for all occupations (MHLW, Medical Affairs Bureau, Nursing Department, 2023). These statistics further underscore the current nursing shortage in Japan.
A high number of licensed nurses who are not currently working as nurses, referred to as “latent nurses,” contributes to the nursing labor shortage. In 2018, the number of latent nurses was estimated to be 518,153, which is 28.37% of those who have nursing licenses (Kobayashi et al., 2020). Resignation from nursing jobs accounts for the majority of latent nurses. A 2011 survey of 20,388 licensed nursing staff showed that 91.6% of latent nurses were staff with one or more resignations (MHLW, Medical Affairs Bureau, Nursing Department, 2011).
Low earnings are a prominent reason for nurse resignations. In a survey of 35,933 nursing staff, the three most frequently cited reasons for leaving were staffing shortages (58.1%), low wages (42.6%), and inflexibility in taking leave (32.6%) (Japan Medical Workers Union, 2023). In response, the Ministry of Health, Labour, and Welfare (MHLW) has been working to improve the working conditions of nurses by raising wages. From February to September 2022, MHLW implemented a subsidy program for medical institutions that played a designated role in COVID-19 care to support an approximately 1% increase in wages (MHLW, 2021). From October 2022, the policy shifted to a mechanism through the medical fee schedule to support an approximately 3% increase for eligible nursing staff (MHLW, Medical Affairs Bureau, 2022). In the 2024 medical fee revision, a broader “base-up” framework was introduced for all healthcare workers, including nursing staff, aiming for wage increases of 2.5% in 2024 and 2% in 2025 (MHLW, Medical Affairs Bureau, 2024).
B. Number of Nurses Per Patient in Japan
The mortality rate increases when the patient-to-nurse ratio rises (Aiken et al., 2002). However, medical institutions in Japan are considered to have a lower number of nurses per patient compared to other countries. Because comparable cross-country data on patient volumes are limited, I proxy staffing allocation intensity using the number of beds, since it is closely tied to the scale of inpatient care. OECD statistics show that the ratio of practicing nurses to hospital beds in Japan, calculated as the number of practicing nurses divided by hospital beds, is approximately 0.97, substantially lower than 3.62 in the United Kingdom and 1.57 in Germany (OECD, n.d.-a, n.d.-b).
To address this issue, the Japanese government is working to promote higher nurse staffing levels by increasing reimbursement for medical institutions that maintain higher staffing levels. In 2006, a 7-to-1 basic hospitalization fee was implemented for medical institutions that allocated one nurse to every seven patients in general wards as one of the categories (Cabinet Office, 2019). This new category was reimbursed at a higher rate than the “10-to-1” staffing category, which had been the highest-reimbursed category prior to the 2006 revision. The increase in the ratio of practicing nurses to beds from 0.62 in 2004 coincided with this policy change. In the 2018 medical fee revision, the inpatient hospitalization fees were reorganized into “Acute Care Inpatient Fees 1 – 7.” Fee 1 corresponds to a 7-to-1 basic hospitalization fee, while the former 10-to-1 basic hospitalization fee was broadly mapped into Fees 4 – 7 (MHLW, 2018). These categories are further differentiated by patient severity and nursing necessity criteria, including a requirement that at least 70% of nursing staff be registered nurses. Fees 2 and 3 were introduced as intermediate categories under a 10-to-1 staffing standard, and they impose higher thresholds for patient severity and nursing-necessity criteria than the former 10-to-1 category (MHLW, 2018).
During the COVID-19 pandemic, medical institutions experienced increases in nursing workloads, including infection prevention and outbreak management (Japanese Nursing Association, 2021). They faced a shortage of nurses who could cope with these additional demands, which likely increased reliance on the hiring of “latent nurses.” The 7-to-1 patient-to-nurse staffing ratio standard has been discussed as a factor that may mitigate pandemic-related staffing pressures. According to the Japan Nursing Association (2021), facilities that were able to cope with increased nursing workloads tended to have a 7-to-1 patient-to-nurse ratio or lower. Therefore, facilities that operated with a 10-to-1 patient-to-nurse staffing ratio or higher may have been more likely to experience severe nursing shortages than 7-to-1 facilities.
II. Literature Review
A. Monopsony and the Nursing Labor Market
Nursing labor markets are often viewed as imperfectly competitive and may exhibit some degree of monopsony power relative to many other occupations. Theoretically, if a medical institution is a wage taker in a competitive labor market, the institution chooses labor L to maximize the following profit function:
(1) $$π(L)=R(L)-wL$$,
where w is the market wage and R(L) is the revenue function. Because the marginal cost of labor equals the wage, the first-order condition is
(2) $$R'(L)=w$$,
where R'(L) is the marginal revenue product of labor (MRPL).
In contrast, under monopsony, the institution faces a labor supply curve with wages increasing in employment, $$w=w(L)$$ with $$^{dw}/_{dL}>0$$ . The profit function is
(3) $$π(L)=R(L)-w(L)L$$.
The first-order condition becomes
(4) $$R'(L)=w(L)+L \text{ } ^{dw}/_{dL}$$ .
Since $$^{dw}/_{dL}>0$$, the marginal cost of labor, $$w(L)+L \text{ } ^{dw}/_{dL}$$, exceeds the wage $$w(L)$$ . Therefore, the institution sets wages lower than under perfect competition in equilibrium. In addition, because $$R'(L)$$ is downward sloping, equating MRPL to the higher marginal cost of labor implies a lower level of employment than under perfect competition.
Yett (1970) offered an early discussion of imperfect competition in the nurse labor market and argued that employer monopsony power can generate a “chronic shortage” of nurses. He explained this by stating that hospitals keep wages below MRPL, which reduces labor supply and leads to employment below the competitive level, contributing to persistent shortages. Sullivan (1989) used U.S. hospital survey data from 1979 to 1985 to estimate hospitals’ monopsony power in the nursing labor market using the inverse elasticity of labor supply to the firm. Using one-year changes in staffing levels and wages, he reported an inverse elasticity of 0.79, which indicates substantial employer market power. Based on three-year changes, he reported 0.26, which could likewise be regarded as substantial. Recently, Matsudaira (2014) conducted an analysis of vocational nurses and nurse aides in California nursing homes. By exploiting a 1999 state minimum-staffing requirement as an exogenous increase in nursing demand, he investigated how annual working hours and wages responded. He used annual hours worked to measure labor input. In a monopsonistic labor market, additional hiring caused by a demand shock increases both employment and wages, because employers move along an upward-sloping labor supply curve to raise the number of nursing staff. In contrast, in a perfectly competitive market, employers adjust the number of staff through perfectly elastic labor supply curve, so they do not need to raise wages to hire additional nurses. The analysis found an increase in working hours but no increase in wages, a pattern more consistent with a competitive labor market.
Hirsch and Schumacher (2005) examined monopsony in the hospital labor markets for registered nurses (RNs) by contrasting two frameworks. In the classic monopsony theory, greater hospital concentration predicts lower wages. In the new monopsony theory, monopsonistic outcomes can arise even in less concentrated markets due to worker mobility frictions. Using data across 240 labor markets, they examined the correlation between wages and measures of concentration, measured by the Herfindahl-Hirschman index (HHI) constructed from the hospital-level daily census (or number of beds). The HHI equals 0 under perfect competition and equals 1 in a single hospital market. They found limited evidence for classic monopsony in the long run, but they documented slower growth in wages in markets where concentration increased in the short run, which is consistent with classic monopsony. They also noted that increases in HHI driven by hospital mergers were associated with lower staffing levels and higher required work effort, consistent with monopsonistic behavior. In contrast, measures of mobility friction showed little correlation with RN wages, providing limited evidence for new monopsony.
Taken together, findings on the characteristics of the nursing labor market are mixed, and the topic remains controversial. Therefore, I test whether the nursing labor market exhibits monopsonistic features by examining whether the responses of wages, employment, and working hours to labor shortages during the COVID-19 pandemic differ by market concentration.
B. Characteristics of the Nursing Labor Market during COVID-19
Several studies have investigated the relationship between COVID-19 and nurse staffing levels in medical institutions. Using a cross-sectional electronic survey of registered nurses holding an active license in New Jersey in October 2020, de Cordova et al. (2022) examined burnout and turnover intentions related to the first pandemic peak. Burnout was measured through the Dolan single-item burnout measure and defined as a score of at least 3 out of 5. They found that 64.3% of nurses met this threshold, and 36.5% reported high turnover intentions within one year. These patterns suggest that pandemic-related burnout may undermine medical institutions’ ability to maintain staffing levels. Additionally, Kaneda et al. (2025) conducted a survey of prefectures, cities, and nursing associations in Japan about how they addressed nursing shortages during the COVID-19 pandemic. They found that these organizations supported medical institutions in securing nursing staff by dispatching staff between hospitals, recruiting latent nurses, and reallocating nurses with infectious disease expertise within facilities. A recent study also examined the effect of staffing intensity on infection control within medical institutions during COVID-19. Using patient-level data from South Korea, Han & Kim (2025) found that general wards in hospitals with a higher patient-to-nurse staffing ratio experienced higher rates of healthcare-associated infections. This suggests that lower staffing levels may contribute to higher infection risks and that higher staffing levels may help reduce healthcare-associated infections.
Ⅲ. Data
A. Unit of Analysis and Sample Period
The analysis uses a prefecture-gender-year panel from 2010 to 2023, constructed by combining government statistics, data from the Japan Medical Association, and medical claims data provided by Japan System Techniques Co., Ltd. (JAST). The paper treats prefecture as the unit of analysis for the labor market, since adjustments to nursing staffing were partially conducted at the prefectural level, as Kaneda et al. (2025) noted. The merged datasets are available from 2006 to 2023, but I exclude observations from 2006 to 2009 because this period coincides with the implementation of the 7-to-1 patient-to-nurse staffing standard. During this period, the job openings-to-applicants ratio shows unusually large values (Appendix Figure A1). The main analysis therefore focuses on 2010 to 2023. The sample is restricted to registered nurses since Acute Care Inpatient Fee 1, which corresponds to the 7-to-1 patient-to-nurse staffing standard, requires at least 70% of nursing staff to be registered nurses.
B. Construction of the Main Outcomes
The main outcomes are scheduled cash earnings, scheduled working hours, overtime hours, and the number of workers. These variables are drawn from the Basic Survey on Wage Structure (BSWS) published by the Ministry of Health, Labour, and Welfare (2025a) and aggregated to the prefecture-gender-year level. Earnings per hour are constructed as scheduled cash earnings divided by scheduled working hours. A description of BSWS is provided in Appendices A1–A3.
C. Construction of the Nursing Shortage Proxies
This analysis uses two proxies for nursing shortages. The first is the job openings-to-applicants ratio, which captures labor market tightness before the pandemic by comparing vacancies with applicants. The ratio is obtained from the Analytical Report on Job Hunting, Recruitment, and Employment for Nurses based on Nurse Center Data issued by the Japan Nursing Association Central Nurse Center (2025). The detailed calculation of the ratio is described in Appendix A4. To capture nursing shortages before the pandemic, I use the mean of the ratio over 2014 to 2019. Averaging over multiple years reduces noise from short-run fluctuations. In addition, the number of beds under the 7-to-1 patient-to-nurse staffing standard peaked in 2014 (Ministry of Health, Labour, and Welfare, Insurance Bureau, 2017). Excluding years prior to 2014 therefore helps construct a pre-pandemic shortage measure that is less affected by the rollout of the 7-to-1 standard. The ratio is reported on a fiscal year basis (April to March) rather than a calendar year basis.
The second proxy is one minus the share of medical institutions that adopted a 7-to-1 patient-to-nurse staffing ratio. Because the share of 7-to-1 facilities reflects baseline staffing capacity prior to the pandemic, this transformation serves as an index of lower staffing capacity. This proxy is constructed using medical claims data called REZULT, provided by Japan System Techniques Co., Ltd. (JAST). I identify medical institutions that adopted Acute Care Inpatient Fee 1 or Fees 1 to 7 in 2019 and compute the bed-weighted share of institutions meeting the 7-to-1 standard. I use 2019 data to capture the pre-pandemic staffing intensity that may affect labor-market adjustment during COVID-19. Appendices A5 to A7 describe the REZULT data and the construction of this measure.
D. Construction of the Labor-Market Concentration Measure
This paper measures concentration in the labor market using the Herfindahl-Hirschman Index (HHI), constructed from hospital-level data on the number of general beds in the Japan Medical Analysis Platform provided by the Japan Medical Association (2025). Appendix A8 details the HHI construction. Prefectures with a high HHI are defined as those with an HHI at or above the median, and low-HHI prefectures are defined as those below the median.
E. Construction of the Control Variables
Control variables that capture characteristics of medical supply and demand include the average age of nurses, the prefectural-level minimum wage, the share of registered nurses among nursing staff, the number of beds, the share of mental hospitals, the share of private hospitals, the number of hospitals, outpatient visits per 100,000 people, and the share of people aged 65 or older. Appendices A9 to A14 describe the construction and data sources for these controls.
F. Log Transformation of Variables
I log-transform all outcome variables (scheduled cash earnings, earnings per hour, scheduled working hours, overtime hours, and the number of workers), nursing shortage measure 1 (the job openings-to-applicants ratio), and the following control variables (the age of nurses, the minimum wage, the number of hospitals, the number of beds, and outpatient visits per 100,000 people). Because overtime hours include zeros, I use log(1+overtime hours) to preserve the full sample. For sufficiently large values, changes in log(1+overtime hours) closely approximate percentage changes in overtime hours. By contrast, I leave ratio variables in levels, including the share of registered nurses among nursing staff, the share of mental hospitals, the share of private hospitals, and the share of people aged 65 or older, as well as the 7-to-1 staffing share measure and the HHI.
IV: Empirical Strategy
A. Difference-in-Difference Specifications
To estimate how the nursing shortage before the pandemic shaped changes in nurses’ outcomes during COVID-19, I use two types of two-way fixed effects difference-in-differences specifications. The following equation presents the pooled DID specification:
(5) $$Y_{i,g,t}=β(\text{NURSING_SHORTAGE}_i × \text{POST}_t) + X’_{i,g,t} γ + δ_i + π_g +λ_t + δ_i × t + π_g × t + ε_{i,g,t}$$ .
$$Y_{i,g,t}$$ denotes the outcome of registered nurses of gender g in prefecture i and year t. NURSING_SHORTAGEi is a pre-pandemic shortage proxy (either the job openings-to-applicants ratio or one minus the share of 7:1 facilities) and is time-invariant. POSTt equals 1 for years 2020-2023 and 0 for 2010-2019. $$X’_{i,g,t}$$ is a vector of control variables. δi , πg and λt are prefecture, gender, and year fixed effects, and δi x t and πg×t are prefecture- and gender-specific linear time trends. The coefficient identifies whether the outcome changed differentially during the pandemic in areas with higher pre-pandemic shortages.
In contrast, equation (6) allows the post-2020 effect of the pre-pandemic shortage to differ by market concentration:
(6) $$Y_{i,g,t}=β(\text{HHI__HIGH}_i × \text{NURSING_SHORTAGE}_i × \text{POST}_t)+X’_{i,g,t}γ+δ_i+π_g+λ_t+δ_i×t+π_g×t+ε_{i,g,t}$$ .
HHI__HIGHi is an indicator equal to 1 if the HHI of prefecture is at or above the median. The corresponding lower-order terms are absorbed by the fixed effects and linear time trends, or would otherwise be collinear with them if included, and are therefore omitted from the equation. The coefficient β identifies whether the shortage-related change in outcomes during COVID-19 differs between high-concentration and low-concentration prefectures.
B. Event-Study Specifications
As a robustness check and to examine dynamic patterns, this paper estimates two event-study specifications. The first pooled specification is:
(7) $$Y_{i,g,t}=∑_{\substack {j=-10 \\ j≠-1}}^3β_j \text{NURSING_SHORTAGE}_i×\Bbb{1}\{t-2020=j\}+X’_{i,g,t} γ+δ_i+π_g+λ_t+δ_i×t+π_g×t+ε_{i,g,t}$$
Here, 2020 is the event year and the event-time indicators span j=-10,…,3. The year before the event (2019, j=-1) is omitted as a reference period. The control vector X’i,g,t includes the average age of nurses, the prefectural minimum wage, the share of registered nurses among nursing staff, the number of beds, and the share of mental hospitals. The coefficient β_j captures the differential change in the outcome at event time j relative to 2019 associated with higher pre-pandemic nursing shortages. The pre-period coefficients (j≦-2) serve as a test for pre-trends.
The second event-study specification allows the effect of the pre-pandemic shortage to differ by market concentration:
(8) $$Y_{i,g,t}=∑_{\substack {j=-10 \\ j≠-1}}^3β_j \text{NURSING_SHORTAGE}_i×\text{HHI__HIGH}_i×\Bbb{1}\{t-2020=j\}+X’_{i,g,t} γ+δ_i+π_g+λ_t+δ_i×t+π_g×t+ε_{i,g,t}$$
In this equation, the control vector X’i,g,t includes all lower-order terms. While the baseline analysis focuses on the coefficients on the triple interaction term and omits lower-order terms, the event-study specification includes these terms so that the dynamic coefficients are not driven by omitted lower-order dynamics and to assess the pre-trends transparently. The coefficient βj measures how the shortage-related change in the outcome at event time j differs by market concentration. In all four specifications, standard errors are clustered by prefecture to allow for serial correlation within prefectures over time.
V. Results
A. Summary Statistics
Table 1 and Appendix Tables B1–B3 summarize the analysis dataset in levels (yen, hours, and persons). The dataset contains 1315 observations of male and female registered nurses at the prefecture × gender × year level, covering 47 prefectures over 2010–2023. The sample is unbalanced due to missing values for male nurses. Table 1 reports descriptive statistics for the full sample and separately for the pre-period (2010–2019) and post-period (2020–2023). In the full sample, scheduled cash earnings average \294,845.900 and earnings per hour average \1,850.604. Scheduled working hours average 159.582 hours per month, overtime hours average 6.643 hours, and the number of workers averages 7,659.947. Nursing shortage measure 1, the job openings-to-applicants ratio, ranges from 1.595 to 6.781 (mean 2.938). Nursing shortage measure 2, one minus the share of medical institutions that adopted the 7-to-1 patient-to-nurse staffing ratio, ranges from 0.183 to 0.677 (mean 0.382). Comparing the pre- and post-periods, scheduled cash earnings, earnings per hour, and the number of workers are higher in the post-period by \21,251.1, \133.438, and 1,769.192. In contrast, scheduled working hours and overtime hours are lower in the post-period by 0.092 hours and 0.756 hours. These comparisons are descriptive and do not have a causal interpretation. Appendix Tables B1–B3 report additional descriptive statistics for high/low shortage groups and high/low HHI groups for the full sample as well as the pre- and post-periods.
Table 1: Summary Statistics for the Full Sample and by Period (pre vs post)
| N | mean | All Period sd |
min | max | Pre-Period mean (sd) |
Post-Period mean (sd) |
Differences mean |
|
|---|---|---|---|---|---|---|---|---|
| Scheduled Cash Earnings (yen) | 1315 | 294845.900 | 27713.970 | 207400.000 | 435700.000 | 288769.200 (26338.760) |
310021.300 (25153.090) |
21252.100 |
| Earnings per Hour (yen) | 1315 | 1850.604 | 194.022 | 1249.704 | 2792.949 | 1812.450 (187.273) | 1945.888 (177.292) |
133.438 |
| Scheduled Working Hours (hours) | 1315 | 159.582 | 5.107 | 139.000 | 182.000 | 159.608 (5.346) |
159.516 (4.459) |
-0.092 |
| Overtime (hours) | 1315 | 6.643 | 3.387 | 0.000 | 25.000 | 6.859 (3.530) |
6.104 (2.933) |
-0.756 |
| Number of Workers (persons) | 1315 | 7659.947 | 11645.330 | 40.000 | 76080.000 | 7154.079 (11175.730) |
8923.271 (12670.440) |
1769.192 |
| Nurses Shortage Measure 1
(Job Openings-to-Applicants Ratio) |
1315 | 2.938 | 0.972 | 1.595 | 6.871 | 2.938 (0.972) |
2.938 (0.972) |
0.000 |
| Nurses Shortage Measure 2
(One Minus the Share of Medical Institutions that adopted a 7:1 Patient-to-Nurse Staffing Ratio) |
1315 | 0.382 | 0.093 | 0.183 | 0.677 | 0.382 (0.093) |
0.382 (0.093) |
0.000 |
| HHI | 1315 | 0.130 | 0.053 | 0.040 | 0.283 | 0.130 (0.053) |
0.130 (0.053) |
0.000 |
| Age of Nurses | 1315 | 38.451 | 3.955 | 24.500 | 51.700 | 37.747 (3.903) |
40.210 (3.517) |
2.463 |
| Minimum Wage (yen) | 1315 | 787.367 | 98.053 | 629.000 | 1113.000 | 745.796 (74.828) |
891.186 (67.443) |
145.391 |
| Share of Registered Nurses Among Nursing Staff | 1315 | 0.500 | 0.401 | 0.009 | 1.000 | 0.501 (0.408) |
0.500 (0.385) |
-0.001 |
| Number of Beds | 1315 | 32890.830 | 26841.050 | 8068.000 | 128351.000 | 33320.550 (26975.500) |
31817.680 (26507.490) |
-1502.870 |
| Share of Mental Hospitals | 1315 | 0.135 | 0.038 | 0.051 | 0.250 | 0.134 (0.037) | 0.139 (0.041) |
0.005 |
| Share of Private Hospitals | 1315 | 0.785 | 0.098 | 0.574 | 0.958 | 0.785 (0.098) |
0.783 (0.100) |
-0.002 |
| Number of Hospitals | 1315 | 178.782 | 137.713 | 43.000 | 651.000 | 180.677 (138.594) |
174.048 (135.554) |
-6.629 |
| Outpatient Visits per 100,000 People | 1315 | 5721.316 | 573.784 | 3984.000 | 7115.000 | 5733.289 (577.633) |
5691.415 (563.707) |
-41.874 |
| Share of People aged 65 or older | 1315 | 0.286 | 0.037 | 0.173 | 0.391 | 0.276 (0.034) |
0.312 (0.032) |
0.036 |
| N (Pre-/Post-) | 939 | 376 |
Figure 1 presents the association between the two nursing shortage measures (the job openings-to-applicants ratio and one minus the share of medical institutions that adopted the 7-to-1 patient-to-nurse staffing ratio) differs by market concentration. The figure shows a positive relationship in high-HHI prefectures and a negative relationship in low-HHI prefectures. This pattern supports the empirical strategy that interacts HHI with the nursing shortage measures when examining wage and labor outcomes. A similar pattern is observed when the job openings-to-applicants ratio is log-transformed (Appendix Figure B1).
Figure 1: Relationship between Nursing Shortage Measure 1 and 2, by HHI Group
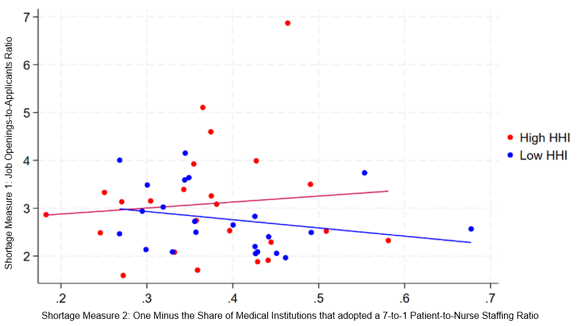
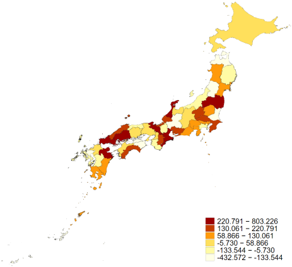
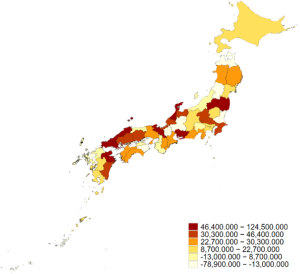
Figure 2: Prefecture-Level Maps of Nursing Shortage Measure 1 and 2 and HHI
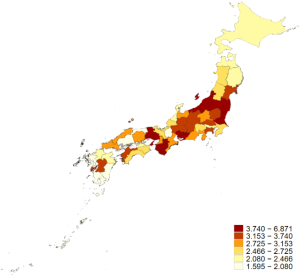
Panel A: Map of Nursing Shortage Measure 1
(Job Openings-to-Applicants Ratio)
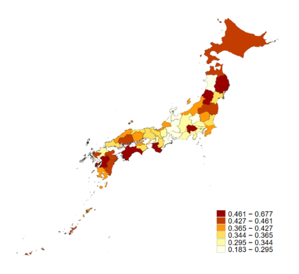
Panel B: Map of Nursing Shortage Measure 2
(One Minus the Share of Medical Institutions that adopted a 7:1 Patient-to-Nurse Staffing Ratio)
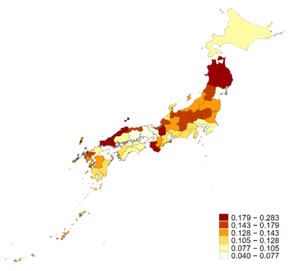
Panel C: Map of the Herfindahl-Hirschman Index (HHI)
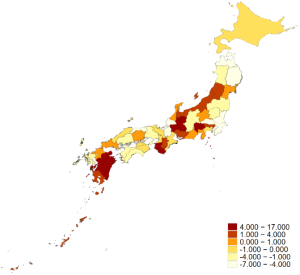
Figure 3: Prefecture-Level Maps of Changes in Earnings per Hour, Scheduled Working Hours, and Number of Workers
Panel A: Map of Earning per Hour (yen), 2023 minus 2019
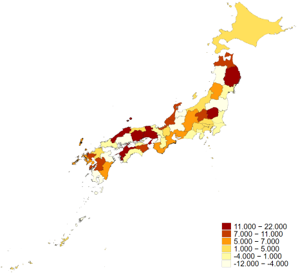
Panel B: Map of Scheduled
Working Hours (hours), 2023 minus 2019
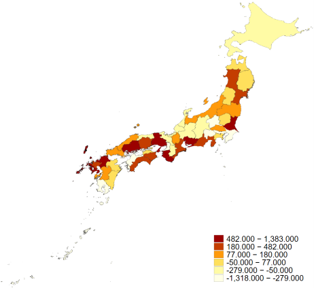
Panel C: Map of Number of Workers (persons), 2023 minus 2019
B. Main Results: Effect of Nursing Shortage Measures on Wages (TWFE)
Table 2 presents estimates of the effect of nursing shortage measure 1, the job openings-to-applicants ratio, on log earnings per hour. Columns (1)–(3) report pooled specifications without splitting prefectures by HHI. Across these specifications, the estimated coefficients are negative, small in magnitude, and statistically insignificant, suggesting no average wage response to pre-pandemic shortages during the COVID-19 period. A similar pattern is observed in Appendix Table C1, which examines log scheduled cash earnings using nursing shortage measure 1. Appendix Tables C3 and C4 likewise report statistically insignificant estimates when nursing shortage measure 2 is used for log earnings per hour and log scheduled cash earnings.
Columns (4)–(6) report heterogeneous wage responses by market concentration using the triple interaction term HHI__HIGHi × NURSING_SHORTAGEi × POSTt. The interaction coefficients are positive and statistically significant once controls are included (columns (5) and (6)). This suggests that earnings per hour responded more strongly to pre-pandemic shortages in high-HHI prefectures than in low-HHI prefectures during the COVID-19 period. Based on column (6), a 10 percent increase in the job openings-to-applicants ratio is associated with about a 0.4 percentage-point larger increase in earnings per hour in high-HHI prefectures relative to low-HHI prefectures.
Appendix Table C1 shows a consistent pattern for the effect of nursing shortage measure 1 on log scheduled cash earnings. The coefficients on the triple interaction term are positive and statistically significant once controls are included. Appendix Tables C3 and C4, which report the effect of nursing shortage measure 2 on log earnings per hour and log scheduled cash earnings, show the same pattern, with positive and statistically significant coefficients. Taken together, these appendix results reinforce the finding that wage responses to pre-pandemic shortages during COVID-19 were stronger in more concentrated prefectures than in less concentrated prefectures.
Table 2: Effect of Nursing Shortage Measure 1 on Log Earnings per Hour
| Log Earnings per Hour | ||||||
|---|---|---|---|---|---|---|
| (1) | (2) | (3) | (4) | (5) | (6) | |
| Nurses Shortage Measure 1 (log)×Post | -0.011 (0.024) |
-0.011 (0.024) |
-0.006 (0.025) |
|||
| Nursing Shortage Measure 1 (log)×Post×HHI | 0.027 (0.016) |
0.041** (0.013) |
0.040** (0.013) |
|||
| Age of Nurses (log) | 0.348*** (0.041) |
0.347*** (0.040) |
0.354*** (0.041) |
0.353*** (0.040) |
||
| Minimum Wage (log) | -0.528 (0.513) |
-0.829 (0.582) |
-0.843 (0.543) |
-1.092 (0.598) |
||
| Share of Registered Nurses Among Nursing Staff | 0.047 (0.038) |
0.047 (0.038) |
0.045 (0.038) |
0.046 (0.038) |
||
| Number of Beds (log) | -0.496* (0.245) |
-0.284 (0.284) |
-0.540* (0.233) |
-0.310 (0.287) |
||
| Share of Mental Hospitals | 1.231 (0.921) |
1.048 (0.965) |
0.932 (0.921) |
0.785 (0.963) |
||
| Share of Private Hospitals | -0.864 (0.654) |
-0.755 (0.671) |
||||
| Number of Hospitals (log) | -0.440 (0.237) |
-0.456 (0.234) |
||||
| Outpatient Visits per 100,000 People (log) | 0.022 (0.064) |
0.037 (0.061) |
||||
| Share of People aged 65 or older | 1.570 (1.827) |
1.306 (1.801) |
||||
| Intercept | 7.521*** (0.007) |
14.622*** (3.976) |
16.721*** (4.316) |
7.514*** (0.002) |
17.177*** (4.206) |
18.684*** (4.480) |
| Prefecture, gender and year fixed effects | Yes | Yes | Yes | Yes | Yes | Yes |
| Prefecture-specific linear trends | Yes | Yes | Yes | Yes | Yes | Yes |
| Gender-specific linear trends | Yes | Yes | Yes | Yes | Yes | Yes |
| N | 1315 | 1315 | 1315 | 1315 | 1315 | 1315 |
Notes: Robust standard errors in parentheses are clustered at the prefecture level. Lower-order terms are absorbed by the fixed effects and linear time trends and are therefore omitted.
* p<0.05, ** p<0.01, *** p<0.001
C. Dynamic Effects of Nursing Shortage Measures on Wages (Event-Study)
Figure 4 reports event-study estimates for nursing shortage measure 1, showing the differential effect on log earnings per hour between high-HHI and low-HHI prefectures relative to 2019. The pre-period coefficients are close to zero, and the joint pre-trend test fails to reject the null hypothesis of no differential pre-trends (p=0.218), supporting the parallel trends assumption. Beginning in 2020, the coefficients turn positive and gradually increase, reaching statistical significance in 2022. These dynamics indicate stronger wage responses to nursing shortages in more concentrated prefectures during the pandemic period and are consistent with the TWFE results.
Panel C of Appendix Figure C2 reports the corresponding event-study estimates for log scheduled cash earnings. The pre-period coefficients are similarly close to zero, although the joint pre-trend test is marginal (p=0.10). While the post-period coefficients trend upward through 2022, statistical significance is not confirmed.
In contrast, the event-study results based on nursing shortage measure 2 provide weaker identification. Panel C of Appendix Figure C1 and Panel D of Appendix Figure C2 report the differential event-study estimates of measure 2 for log earnings per hour and log scheduled cash earnings, comparing high- and low-HHI prefectures relative to 2019. Both panels display differential pre-trends, which weakens the parallel trends assumption. Therefore, nursing shortage measure 2 is treated as a supplementary indicator for examining the effects of nursing shortages.
Panels A and B of Appendix Figures C1 and C2 report pooled event-study estimates for nursing shortage measures 1 and 2 on log earnings per hour and log scheduled cash earnings. The post-period coefficients are statistically insignificant, and the pre-period estimates suggest the presence of pre-trends, providing only limited evidence of wage responses to pre-pandemic nursing shortages.
Figure 4: Event Study of Differential Effects of Nursing Shortage Measure 1 on Log Earnings per Hour by Market Concentration (High vs Low HHI)
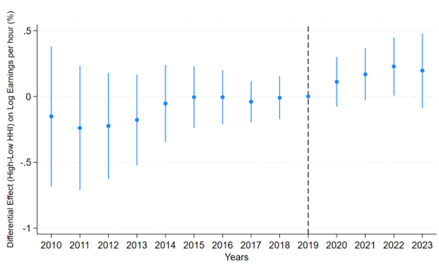
Notes: Estimates include prefecture, year, and gender fixed effects, as well as prefecture- and gender-specific linear time trends. The specification also includes all lower-order terms of the triple interaction to reduce potential confounding and to assess the pre-trends transparently. The omitted reference year is 2019. Standard errors are clustered at the prefecture level.
(Wald F-test: F(9, 46)=1.40, p=0.218).
D. Effects of Nursing Shortage Measures on Working Hours and Number of Workers (TWFE and Event Study)
Tables 3 and 4 report DID estimates for the effects of nursing shortage measure 1 on log scheduled working hours and log number of workers. Across all specifications, including pooled estimates and heterogeneous effects by market concentration, the coefficients are small and statistically insignificant. Appendix Table C2 presents the corresponding estimates for log overtime hours, and the coefficients are similarly statistically insignificant. Appendix Tables C5–C7 report the effects of nursing shortage measure 2 on log scheduled working hours, log overtime hours, and log number of workers. These results also show statistically insignificant coefficients across specifications.
The event-study estimates are consistent with these null results. Panel A–D of Appendix Figure C3-C5 show outcome changes in working hours and the number of workers under pooled and market-concentration-heterogeneous specifications using nursing shortage measures 1 and 2. They show evidence of pre-trends in some cases and statistically insignificant coefficients in the post-period in others. Overall, these findings suggest limited evidence that pre-pandemic shortages affected working hours or employment during COVID-19.
Table 3: Effect of Nursing Shortage Measure 1 on Log Scheduled Working Hours
| Log Scheduled Working Hours | |||||||
|---|---|---|---|---|---|---|---|
| (1) | (2) | (3) | (4) | (5) | (6) | ||
| Nurses Shortage Measure 1 (log)×Post | 0.010 (0.009) |
0.012 (0.010) |
0.011 (0.010) |
||||
| Nursing Shortage Measure 1 (log)×Post×HHI | -0.005 (0.005) |
-0.005 (0.006) |
-0.005 (0.006) |
||||
| Age of Nurses (log) | -0.016 (0.009) |
-0.016 (0.009) |
-0.017 (0.009) |
-0.017 (0.009) |
|||
| Minimum Wage (log) | -0.133 (0.178) |
-0.103 (0.199) |
-0.118 (0.198) |
-0.074 (0.210) |
|||
| Share of Registered Nurses Among Nursing Staff | -0.007 (0.012) |
-0.007 (0.012) |
-0.007 (0.012) |
-0.007 (0.012) |
|||
| Number of Beds (log) | 0.229 (0.127) |
0.195 (0.152) |
0.232 (0.129) |
0.197 (0.158) |
|||
| Share of Mental Hospitals | -0.396 (0.388) |
-0.368 (0.415) |
-0.301 (0.387) |
-0.280 (0.412) |
|||
| Share of Private Hospitals | 0.067 (0.217) |
0.043 (0.216) |
|||||
| Number of Hospitals (log) | 0.065 (0.098) |
0.072 (0.096) |
|||||
| Outpatient Visits per 100,000 People (log) | -0.002 (0.031) |
-0.005 (0.031) |
|||||
| Share of People aged 65 or older | -0.159 (0.728) |
-0.219 (0.755) |
|||||
| Intercept | 5.069*** (0.003) |
3.747* (1.784) |
3.571 (1.853) |
5.073*** (0.001) |
3.604 (1.880) |
3.388 (1.878) |
|
| Prefecture, gender and year fixed effects | Yes | Yes | Yes | Yes | Yes | Yes | |
| Prefecture-specific linear trends | Yes | Yes | Yes | Yes | Yes | Yes | |
| Gender-specific linear trends | Yes | Yes | Yes | Yes | Yes | Yes | |
| N | 1315 | 1315 | 1315 | 1315 | 1315 | 1315 | |
Notes: Robust standard errors in parentheses are clustered at the prefecture level. Lower-order terms are absorbed by the fixed effects and linear time trends and are therefore omitted.
* p<0.05, ** p<0.01, *** p<0.001
Table 4: Effect of Nursing Shortage Measure 1 on Log Number of Workers
| Log Number of Workers | ||||||
|---|---|---|---|---|---|---|
| (1) | (2) | (3) | (4) | (5) | (6) | |
| Nurses Shortage Measure 1 (log)×Post | -0.159 (0.138) |
-0.163 (0.136) |
-0.176 (0.121) |
|||
| Nursing Shortage Measure 1 (log)×Post×HHI | 0.010 (0.067) |
0.007 (0.067) |
-0.001 (0.064) |
|||
| Age of Nurses (log) | 0.211 (0.148) |
0.200 (0.148) |
0.220 (0.147) |
0.208 (0.147) |
||
| Minimum Wage (log) | 2.103 (3.227) |
0.920 (3.112) |
2.378 (3.208) |
0.953 (3.087) |
||
| Share of Registered Nurses Among Nursing Staff | 5.460*** (0.217) |
5.465*** (0.216) |
5.458*** (0.216) |
5.463*** (0.215) |
||
| Number of Beds (log) | -1.006 (1.587) |
-3.612 (1.980) |
-0.986 (1.590) |
-3.580 (1.953) |
||
| Share of Mental Hospitals | 3.020 (4.971) |
5.144 (4.689) |
2.014 (4.943) |
4.167 (4.492) |
||
| Share of Private Hospitals | -0.330 (3.026) |
-0.142 (3.092) |
||||
| Number of Hospitals (log) | 4.161** (1.389) |
4.078** (1.351) |
||||
| Outpatient Visits per 100,000 People (log) | -0.163 (0.348) |
-0.140 (0.352) |
||||
| Share of People aged 65 or older | 5.546 (9.706) |
7.136 (9.639) |
||||
| Intercept | 8.090*** (0.041) |
0.390 (26.562) |
13.938 (24.573) |
8.042*** (0.010) |
-1.583 (26.360) |
13.068 (24.150) |
| Prefecture, gender and year fixed effects | Yes | Yes | Yes | Yes | Yes | Yes |
| Prefecture-specific linear trends | Yes | Yes | Yes | Yes | Yes | Yes |
| Gender-specific linear trends | Yes | Yes | Yes | Yes | Yes | Yes |
| N | 1315 | 1315 | 1315 | 1315 | 1315 | 1315 |
Notes: Robust standard errors in parentheses are clustered at the prefecture level. Lower-order terms are absorbed by the fixed effects and linear time trends and are therefore omitted.
* p<0.05, ** p<0.01, *** p<0.001
E. Robustness Checks
I conduct several robustness checks to assess the stability of the estimated effect of nursing shortage measure 1 on log earnings per hour in high-HHI prefectures. First, Figure 4 provides an event-study plot for this estimate, which serves as a check of the parallel trends assumption. The pre-period coefficients are close to zero, and the joint Wald F-test fails to reject the null hypothesis of no differential pre-trends (p = 0.218), supporting the validity of the TWFE specification.
Second, Appendix Table D1 reassesses the effect of nursing shortage measure 1 on earnings per hour in high-HHI areas relative to low-HHI areas by redefining high- and low-HHI prefectures as the top and bottom terciles of the HHI distribution. The estimates with control variables in columns (2) and (3) are positive and statistically significant, reinforcing the findings of stronger wage responses to nursing shortages in more concentrated prefectures.
Third, Appendix Table D2 re-estimates the results using more conservative clustering choices. When standard errors are two-way clustered by prefecture and year, the coefficients in columns (2) and (3) with controls remain positive and statistically significant. This indicates that the findings are not driven by a particular clustering structure.
Finally, Appendix Table D3 presents placebo tests that reassign the treatment year to 2017 and 2018. I exclude 2019 from the placebo tests because the job openings-to-applicants ratio is reported on a fiscal-year basis, and the 2019 measure may partially capture early pandemic-related conditions. Across all placebo specifications, the estimates are small and statistically insignificant, suggesting no evidence of differential wage effects prior to COVID-19. Overall, these results support the conclusion that earnings per hour increased more in high-HHI prefectures as nursing shortage measure 1 increased during the COVID-19 period.
Ⅵ. Conclusion
A. Main Findings and Interpretations
This paper examines the effects of nursing shortages on nurses’ wages and labor outcomes, allowing the differential effects to vary with labor market concentration. The main finding in the analysis is that earnings per hour increased more in high-HHI prefectures than in low-HHI prefectures in response to nursing shortage measure 1 during the pandemic period. In contrast, I do not find statistically significant effects on working hours or the number of workers.
This main finding is consistent with the mechanism discussed in Matsudaira (2014). Under perfect competition, a medical institution faces a perfectly elastic labor supply curve, which limits its wage-setting power to attract additional workers in response to a demand shock. By contrast, under monopsony, an institution faces an upward-sloping labor supply curve and must raise wages in order to hire additional nurses. The stronger wage response in more concentrated labor markets than in less concentrated labor markets during the pandemic, in response to pre-pandemic shortages, is consistent with monopsonistic wage-setting. However, it does not establish that the labor market is monopsonistic because the analysis is based on aggregate data.
In contrast to the wage results, limited evidence is found for the effect on working hours and the number of workers. Several factors may explain these null findings. First, nurse separations and job exits also occurred during the pandemic period, which may have offset hiring responses and made it difficult to detect effects in aggregate outcomes. Second, the main outcomes are drawn from a sampling survey that includes registered nurses working in facilities other than general hospitals, such as clinics and long-term care facilities. As a result, the impacts of COVID-19 on general hospitals may be attenuated when outcomes are aggregated at the prefecture-year-gender level. Third, some event-study specifications indicate evidence of pre-trends, suggesting different trajectories prior to the pandemic across areas with high versus low nursing shortages. This undermines the parallel trends assumption and weakens the interpretability of difference-in-differences specifications for these outcomes.
The analysis also suggests that the two nursing shortage measures capture different dimensions of nursing shortages: the job openings-to-applicants ratio reflects direct labor-market tightness before the pandemic, whereas one minus the share of 7-to-1 facilities reflects lower pre-pandemic nurse staffing capacity. Because the event-study results for wage outcomes are more stable when shortages are measured by the job openings-to-applicants ratio, I treat this ratio as the primary measure and one minus the share of 7-to-1 facilities as a supplementary measure.
Furthermore, the relationship between the two shortage measures varies with market concentration. In high-HHI prefectures, the two measures are positively correlated, suggesting that lower baseline staffing capacity is more closely linked to higher labor-market tightness in more concentrated markets. Equivalently, a higher share of 7-to-1 facilities is associated with lower labor-market tightness in high-HHI prefectures.
B. Policy Implications
These findings suggest two policy implications. First, the stronger wage response to shortages in more concentrated labor markets implies the presence of employer monopsony power, which can keep wages below the competitive level. Under such conditions, wage-raising policies to improve recruitment may be effective, particularly in concentrated markets. Second, because working hours and employment outcomes appear to follow different trends before the COVID-19 pandemic in the prefectures with high versus low shortage measures, identification is weaker, and observed changes in these outcomes during COVID-19 cannot be directly interpreted as causal effects of nursing shortages. Therefore, policymakers should treat the evidence for working hours and employment as suggestive and complement it with additional data and research designs that more clearly assess pre-trends.
C. Limitations
This paper has three limitations. First, the analysis uses aggregated data at the prefecture-year-gender level. Given this level of aggregation, I cannot observe hospital-level wage setting, staffing adjustment, or within-prefecture reallocation. If unobserved confounders operate at the hospital level, they may bias the estimates.
Second, the impact of the COVID-19 shock likely differed across types of medical institutions categorized by acute care inpatient fee. In particular, the share of institutions that accepted COVID-19 patients varies by acute care inpatient fee category, which may affect analyses using shortage measure 2. According to MHLW (2023), roughly 90% of institutions under Acute Care Inpatient Fee 1 accepted COVID-19-related patients. By contrast, acceptance rates were about 90% for Fees 2 and 3 but around 60% for Fees 4–6. This heterogeneity could weaken the identification strategy because the pandemic shock did not increase workloads uniformly across fee categories.
Third, nationwide wage-support policies for nurses were introduced starting in 2022. Although these policies do not vary across prefectures and are therefore absorbed by year fixed effects, they may still influence the estimates if they affect outcomes differently across areas with different levels of shortages or market concentration.
D. Future Work
Future work should examine the hypothesis using hospital-level data. This would enable a more direct examination of changes in labor and wage outcomes in response to nursing shortages. In addition, incorporating measures that capture the burden of the pandemic would be valuable. For example, including bed shortage as a measure could help control for heterogeneous COVID-19 demand shocks across prefectures.
Ⅶ. Acknowledgements
I am deeply grateful to Professor Yoko Ibuka for helpful comments. My gratitude also goes to Japan System Techniques Co., Ltd., for providing access to medical claims data used in this study. I used a generative AI tool (ChatGPT 5.2, OpenAI) for language editing and enhancing readability. I take full responsibility for the empirical strategy, results, analysis, and all remaining errors. The views and opinions expressed in this paper are those of the author and do not necessarily reflect those of the data provider. The author declares no conflict of interest.
Ⅷ. Appendices
Appendix A. Data Definitions and Sources
A1. Basic Survey of Wage Structure (BSWS)
The BSWS is an annual sampling survey conducted in June (with earnings surveyed in July). The sample is restricted to respondents aged 15 or older who (a) worked at least 15 days, (b) worked on average at least 5 hours per day, and (c) earned scheduled cash earnings of at least 50,000 yen (MHLW, 2025a).
A2. Identifying Registered Nurses (BSWS)
In the BSWS, occupations are classified based on job content. Therefore, even if a job title differs, respondents are classified as registered nurse if their job content corresponds to that occupation. If respondents hold multiple jobs, the occupation is determined based on the relative importance of each job and the number of working hours (MHLW, 2025a).
A3. Definition of Variables (BSWS)
All variables are aggregated to the prefecture-gender-year level.
- Scheduled Cash Earnings: Contractual cash earnings minus overtime cash earnings.
- Contractual Cash Earnings: Earnings determined by contractual agreement before deductions for income tax and social insurance premiums; includes basic salary and allowances (e.g., job, commuting, family, and perfect attendance allowances).
- Overtime Cash Earnings: Earnings for overtime work, night work, holiday work, night-shift work, and temporary shift work.
- Number of Workers: Constructed by applying sampling weights to the number of workers in the survey.
- Average Age: Mean age of respondents in the survey month.
A4. Construction Method for the Job Openings-to-Applicants ratio
For each prefecture and year, I extract the number of job openings for registered nurses (by desired occupation) and the number of job seekers for registered nurses (by desired occupation) from the Analytical Report on Job Hunting, Recruitment, and Employment for Nurses based on Nurse Center Data (Japan Nursing Association Central Nurse Center, 2025). The ratio is computed as job openings divided by job seekers.
A5. REZULT Provided by Japan System Techniques Co., Ltd. (JAST)
Medical claims data are billing records that medical institutions issue to patients’ insurers. These records include information on who received care, when and where care was provided, and what treatments or prescriptions were provided.
REZULT is a medical claims database provided by Japan System Techniques Co., Ltd. It contains prescription-related claims (medical, dental, and pharmacy), health checkup records, enrollee basic information, and medical institution information for health insurance associations (large company employees and their families) and mutual aid associations (civil servants and their families) (JAST, n.d.). It covers approximately 10 million people, and the prefectural population shares in the data align with the actual prefectural population shares. The REZULT database includes more than 90% of medical institutions.
A6. Note on Data Access and Confidentiality of Medical Claims Data
The claims data are not publicly available due to contractual restrictions. The data provider de-identifies individual records; therefore, the dataset does not contain any personally identifiable information. The data are further aggregated to the prefectural level for analysis.
A7. Calculation of the Share of Medical Institutions that Adopted the 7-to-1 Patient-to-Nurse Staffing Ratio
I extracted hospitals that adopted Acute Care Inpatient Fee 1 in 2019, which corresponds to the 7-to-1 patient-to-nurse staffing ratio. In addition, I extracted hospitals that adopted Acute Care Inpatient Fees 1-7 in 2019 to identify all hospitals with general wards eligible for Acute Care Inpatient Fees.
REZULT includes information on the number of beds for each medical institution, reported in bed-size categories (0–99, 100–199, 200–299, 300–399, 400–499, and 500 or more). To approximate bed counts, I assigned representative values to each category: 0–99→50, 100–199→150, 200–299→250, 300–399→350, 400–499→450, and 500+→550. Using these values, I computed the bed-weighted share of 7-to-1 facilities as follows:
$$Share_p=\frac{∑_{i∈p} \text{Number of Beds}_i× \Bbb{1}\{\text{Acute Care Fee}_i=1\}}{∑_{i∈p}\text{Number of Beds}_i× \Bbb{1}(\text{Acute Care Fee}_i∈\{1,…,7\})}$$
where i indexes medical institutions and p indexes prefectures.
A8. Construction of the Herfindahl-Hirschman Index (HHI)
For each secondary medical area, I identify all hospitals that operate general beds and calculate the Herfindahl-Hirschman Index (HHI) using the distribution of general beds across hospitals in the area. The procedure is as follows. Let denote hospital ’s share of general beds in a secondary medical area, calculated as hospital ’s number of general beds divided by the total number of general beds in the secondary medical area. The area-level HHI is calculated as:
(A1) $$HHI=\sum_{i=1}^{n} S_i^2$$
This calculation follows the approach described in the Cabinet Office policy issue analysis report (Director General for Policy Coordination, Cabinet Office, 2017). The prefecture-level HHI is computed as a weighted average of secondary-medical-area HHIs, where the weights equal each area’s share of general beds within the prefecture.
A9. Construction of Control Variables
Control variables are constructed as follows:
Average Age of Nurses: Obtained from the Basic Survey of Wage Structure (MHLW, 2025a).
Minimum Wage of Prefecture: Obtained from Regional Minimum Wage Revisions (MHLW, 2025d).
Share of Registered Nurses Among Nursing Staff: Number of registered nurses divided by the sum of registered nurses, assistant nurses, and nurse aides, drawn from the Basic Survey of Wage Structure (MHLW, 2025a).
Number of Beds: Collected from the Survey of Medical Institutions (MHLW, 2025b). A description of the Survey of Medical Institutions is written in Appendix A10.
Share of Mental Hospitals: Number of mental hospitals divided by the number of hospitals, drawn from the Survey of Medical Institutions (MHLW, 2025b). Definitions are described in Appendix A11.
Share of Private Hospitals: Number of private hospitals divided by the number of hospitals, drawn from the Survey of Medical Institutions (MHLW, 2025b). Private hospitals are defined as those not established by the government, public medical institutions, or social insurance organizations. Definitions are provided in Appendix A11.
Number of Hospitals: Collected from the Survey of Medical Institutions (MHLW, 2025b)
Outpatient Visits per 100,000 People: Obtained from the Patient Survey (MHLW, 2025c). Definitions are described in Appendices A12–A13.
Share of People Aged 65 or older: Population aged 65 or older divided by the total population, computed from Population Estimates (Internal Affairs and Communications, 2025). A description is provided in Appendix A14.
A10. Description of the Survey of Medical Institutions
The Survey of Medical Institutions consists of a cross-sectional survey conducted every three years and a monthly survey. The cross-sectional survey covers all medical institutions in Japan, while the monthly survey records medical institutions that are opened, closed, or changed under the Medical Care Act (MHLW, 2025b).
A11. Definition of Variables (Survey of Medical Institutions)
All variables are aggregated to the prefecture-year level.
- Hospitals: Facilities where physicians or dentists provide medical care and have inpatient capacity for 20 or more patients.
- Mental Hospitals: Facilities that have only psychiatric beds, which are beds designated for patients with psychiatric conditions.
- Hospitals established by the government: Hospitals established by the Ministry of Health, Labour, and Welfare; the National Hospital Organization; the National University Corporation; the Japan Occupational Health and Safety Organization; the National Center for Advanced Medical Care; or the Japan Community Health Care Organization.
- Hospitals established by public medical institutions: Hospitals established by prefectures or municipalities; local independent administrative institutions; the Japan Red Cross; the Social Welfare Corporation Saiseikai Foundation; the Hokkaido Social Work Association; the Welfare Agricultural Cooperative Association; or the National Health Insurance Association.
- Hospitals established by social insurance organizations: The hospitals established by health insurance societies and their federations; mutual aid societies and their federations; or national health insurance societies.
A12. Description of the Patient Survey
The Patient Survey is an annual sampling survey conducted in September and October. This survey targets patients using medical institutions. Discharged patients are surveyed in September, and outpatients and inpatients are surveyed on one of three designated days (MHLW, 2025c).
A13. Definition of Variables (Patient Survey)
Variables are aggregated to the prefecture-year level.
- Outpatient visits per 100,000 people: The estimated number of outpatients per 100,000 people across all medical institutions.
A14. Description of the Population Estimates
The Population Estimates provide annual prefecture-level population counts as of October 1 each year. Using the census as the benchmark, prefecture populations are updated based on natural change (births minus deaths) and net migration (in-migration minus out-migration), including inter-prefectural migration (Ministry of Internal Affairs and Communications, 2025).
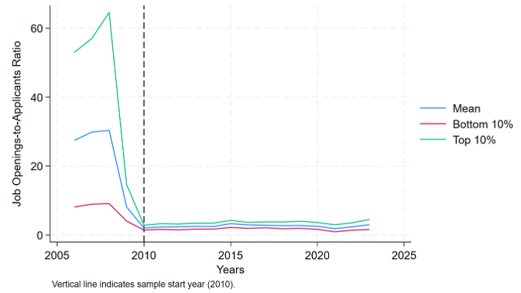
Figure A1: Job Openings-to-Applicants Ratio for Registered Nurses, 2006-2023
Appendix B. Summary Statistics
Table B1: Summary Statistics by Nursing Shortage Measure 1 Group (High vs Low), Full Sample, Pre-Period, and Post-Period
| High Shortage Measure 1 | Low Shortage Measure 1 | |||||||
|---|---|---|---|---|---|---|---|---|
| All Period mean (sd) |
Pre-Period mean (sd) |
Post-Period mean (sd) |
Differences mean |
All Period mean (sd) |
Pre-Period mean (sd) |
Post-Period mean (sd) |
Differences mean |
|
| Scheduled Cash Earnings (yen) | 287958.200 (26279.710) |
295181.000 (25868.590) |
317112.000 (25013.230) |
21931.000 | 301456.300 (27462.140) |
282092.600 (25164.000) |
302622.300 (23144.410) |
20529.700 |
| Earnings per Hour (yen) | 1799.561 (185.738) |
1861.547 (182.306) |
1994.511 (172.512) |
132.964 | 1899.594 (189.240) |
1761.326 (178.674) |
1895.151 (168.169) |
133.825 |
| Scheduled Working Hours (hours) | 160.283 (5.135) |
158.814 (5.238) |
159.146 (4.317) |
0.332 | 158.909 (4.991) |
160.435 (5.337) |
159.902 (4.582) |
-0.533 |
| Overtime (hours) | 6.286 (3.520) |
7.213 (3.318) |
6.422 (2.890) |
-0.791 | 6.987 (3.219) |
6.491 (3.707) |
5.772 (2.948) |
-0.720 |
| Number of Workers (persons) | 7025.016 (12006.670) |
7724.927 (10892.600) |
9627.500 (12060.580) |
1902.573 | 8269.329 (11262.980) |
6559.652 (11444.730) |
8188.424 (13270.110) |
1628.772 |
| Nurses Shortage Measure 1 | 2.217 (0.286) |
3.630 (0.892) |
3.628 (0.893) |
-0.001 | 3.629 (0.891) |
2.217 (0.286) |
2.217 (0.286) |
0.000 |
| Nurses Shortage Measure 2 | 0.412 (0.098) |
0.354 (0.078) |
0.354 (0.079) |
0.000 | 0.354 (0.078) |
0.412 (0.098) |
0.412 (0.099) |
0.000 |
| HHI | 0.133 (0.057) |
0.127 (0.050) |
0.127 (0.050) |
0.000 | 0.127 (0.049) |
0.133 (0.057) |
0.133 (0.057) |
0.000 |
| Age of Nurses | 38.828 (3.994) |
37.398 (3.819) |
39.811 (3.509) |
2.413 | 38.089 (3.887) |
38.109 (3.960) |
40.626 (3.487) |
2.517 |
| Minimum Wage (yen) | 770.450 (96.044) |
761.921 (73.811) |
907.594 (65.843) |
145.673 | 803.604 (97.282) |
729.004 (72.214) |
874.065 (64.953) |
145.061 |
| Share of Registered Nurses Among Nursing Staff | 0.500 (0.397) |
0.501 (0.411) |
0.500 (0.392) |
-0.001 | 0.501 (0.405) |
0.500 (0.405) |
0.500 (0.379) |
0.000 |
| Number of Beds | 30896.460 (30348.260) |
35258.190 (22883.660) |
33674.190 (22740.540) |
-1584.000 | 34804.950 (22837.080) |
31302.870 (30556.920) |
29880.450 (29878.450) |
-1422.420 |
| Share of Mental Hospitals | 0.140 (0.034) |
0.130 (0.040) |
0.134 (0.043) |
0.004 | 0.131 (0.041) |
0.138 (0.032) |
0.145 (0.037) |
0.007 |
| Share of Private Hospitals | 0.781 (0.109) |
0.789 (0.086) |
0.788 (0.090) |
-0.001 | 0.788 (0.087) |
0.782 (0.108) |
0.778 (0.110) |
-0.004 |
| Number of Hospitals | 176.537 (160.945) |
182.785 (111.615) |
176.323 (109.665) |
-6.462 | 180.936 (111.017) |
178.483 (162.082) |
171.674 (158.398) |
-6.809 |
| Outpatient Visits per 100,000 People | 5779.677 (617.842) |
5669.587 (520.883) |
5654.615 (527.436) |
-14.972 | 5665.303 (522.416) |
5799.622 (625.031) |
5729.815 (598.251) |
-69.807 |
| Share of People aged 65 or older | 0.289 (0.041) |
0.274 (0.031) |
0.308 (0.026) |
0.034 | 0.284 (0.033) |
0.278 (0.037) |
0.316 (0.038) |
0.037 |
| N | 644 | 479 | 192 | 671 | 460 | 184 | ||
Table B2: Summary Statistics by Nursing Shortage Measure 2 Group (High vs Low), Full Sample, Pre-Period, and Post-Period
| High Shortage Measure 2 | Low Shortage Measure 2 | |||||||
|---|---|---|---|---|---|---|---|---|
| All Period mean (sd) |
Pre-Period mean (sd) |
Post-Period mean (sd) |
Differences mean |
All Period mean (sd) |
Pre-Period mean (sd) |
Post-Period mean (sd) |
Differences mean |
|
| Scheduled Cash Earnings (yen) | 286904.500 (25597.870) |
281013.500 (24648.120) |
301631.800 (21751.290) |
20618.300 | 303145.400 (27425.670) |
296879.700 (25620.960) |
318775.500 (25529.770) |
21895.800 |
| Earnings per Hour (yen) | 1792.419 (181.3222) |
1755.591 (178.685) |
1884.487 (153.302) |
128.896 | 1911.415 (188.248) |
1871.911 (177.492) |
2009.958 (178.323) |
138.047 |
| Scheduled Working Hours (hours) | 160 (5.286) |
160.377 (5.515) |
160.240 (4.679) |
-0.138 | 158.792 (4.790) |
158.804 (5.045) |
158.761 (4.095) |
-0.043 |
| Overtime (hours) | 6.573 (3.596) |
6.683 (3.723) |
6.297 (3.251) |
-0.386 | 6.717 (3.154) |
7.044 (3.312) |
5.902 (2.552) |
-1.141 |
| Number of Workers (persons) | 5512.366 (6833.445) |
5186.313 (6634.608) |
6327.500 (7260.941) |
1141.187 | 9904.386 (14794.800) |
9211.874 (14193.500) |
11631.900 (16109.100) |
2420.026 |
| Nurses Shortage Measure 1 | 2.955 (1.172) |
2.955 (1.172) |
2.955 (1.174) |
0.000 | 2.920 (0.704) |
2.920 (0.705) |
2.920 (0.705) |
0.000 |
| Nurses Shortage Measure 2 | 0.453 (0.070) |
0.453 (0.070) |
0.453 (0.070) |
0.000 | 0.309 (0.046) |
0.309 (0.046) |
0.309 (0.046) |
0.000 |
| HHI | 0.134 (0.045) |
0.134 (0.046) |
0.134 (0.046) |
0.000 | 0.125 (0.060) |
0.125 (0.060) |
0.125 (0.060) |
0.000 |
| Age of Nurses | 38.842 (4.004) |
38.116 (3.983) |
40.657 (3.450) |
2.541 | 38.042 (3.865) |
37.360 (3.783) |
39.743 (3.536) |
2.383 |
| Minimum Wage (yen) | 763.613 (87.316) |
722.363 (60.725) |
866.740 (50.686) |
144.377 | 812.193 (102.477) |
770.301 (80.209) |
916.696 (73.199) |
146.395 |
| Share of Registered Nurses Among Nursing Staff | 0.500 (0.399) |
0.500 (0.406) |
0.500 (0.381) |
0.000 | 0.501 (0.404) |
0.501 (0.410) |
0.500 (0.391) |
-0.001 |
| Number of Beds | 25700.290 (18035.080) |
26109.380 (18205.480) |
24677.570 (17607.040) |
-1431.810 | 40405.670 (31998.620) |
40861.640 (32127.570) |
39268.220 (31733.070) |
-1593.420 |
| Share of Mental Hospitals | 0.140 (0.030) |
0.138 (0.029) |
0.145 (0.033) |
0.007 | 0.131 (0.044) |
0.130 (0.043) |
0.133 (0.047) |
0.003 |
| Share of Private Hospitals | 0.782 (0.100) |
0.783 (0.100) |
0.781 (0.101) |
-0.002 | 0.788 (0.097) |
0.788 (0.096) |
0.786 (0.099) |
-0.003 |
| Number of Hospitals | 150.830 (104.902) |
152.783 (106.217) |
145.948 (101.648) |
-6.835 | 207.994 (160.130) |
209.848 (160.847) |
203.370 (158.670) |
-6.478 |
| Outpatient Visits per 100,000 People | 5785.077 (618.729) |
5813.208 (616.363) |
5714.750 (620.642) |
-98.458 | 5654.678 (514.800) |
5649.712 (521.852) |
5667.065 (497.951) |
17.353 |
| Share of People aged 65 or older | 0.293 (0.035) |
0.282 (0.033) |
0.321 (0.027) |
0.038 | 0.279 (0.038) |
0.269 (0.034) |
0.303 (0.035) |
0.034 |
| N | 672 | 480 | 192 | 643 | 459 | 184 | ||
Table B3: Summary Statistics by HHI (High vs Low), Full Sample, Pre-Period, and Post-Period
| High HHI | Low HHI | |||||||
|---|---|---|---|---|---|---|---|---|
| All Period mean (sd) |
Pre-Period mean (sd) |
Post-Period mean (sd) |
Differences mean |
All Period mean (sd) |
Pre-Period mean (sd) |
Post-Period mean (sd) |
Differences mean |
|
| Scheduled Cash Earnings (yen) | 292768.300 (27316.200) |
285699.200 (25267.230) |
310441.100 (24098.370) |
24741.900 | 297017.100 (27980.340) |
291979.700 (27071.570) |
309583.200 (26267.380) |
17603.500 |
| Earnings per Hour (yen) | 1832.529 (188.596) |
1788.285 (178.241) |
1943.139 (167.519) |
154.854 | 1869.495 (197.922) |
1837.722 (193.257) |
1948.757 (187.364) |
111.035 |
| Scheduled Working Hours (hours) | 160.005 (5.199) |
160.035 (5.524) |
159.927 (4.290) |
-0.108 | 159.140 (4.974) |
159.161 (5.121) |
159.087 (4.601) |
-0.074 |
| Overtime (hours) | 6.771 (3.437) |
6.952 (3.583) |
6.318 (3.002) |
-0.634 | 6.510 (3.330) |
6.763 (3.476) |
5.880 (2.849) |
-0.882 |
| Number of Workers (persons) | 4370.193 (4283.677) |
4016.292 (4012.027) |
5254.948 (4795.398) |
1238.656 | 11098.070 (15336.830) |
10435.420 (14759.730) |
12751.090 (16616.970) |
2315.670 |
| Nurses Shortage Measure 1 | 3.095 (1.172) |
3.095 (1.172) |
3.095 (1.174) |
0.000 | 2.774 (0.666) |
2.773 (0.667) |
2.774 (0.667) |
0.000 |
| Nurses Shortage Measure 2 | 0.373 (0.091) |
0.373 (0.091) |
0.373 (0.091) |
0.000 | 0.392 (0.095) |
0.392 (0.095) |
0.392 (0.095) |
0.000 |
| HHI | 0.170 (0.042) |
0.170 (0.042) |
0.170 (0.042) |
0.000 | 0.088 (0.022) |
0.088 (0.022) |
0.088 (0.022) |
0.000 |
| Age of Nurses | 38.579 (4.042) |
37.927 (4.007) |
40.208 (3.662) |
2.281 | 38.317 (3.861) |
37.558 (3.787) |
40.211 (3.370) |
2.654 |
| Minimum Wage (yen) | 766.941 (85.453) |
725.883 (58.532) |
869.583 (47.268) |
143.700 | 808.715 (105.607) |
766.619 (83.870) |
913.728 (77.384) |
147.110 |
| Share of Registered Nurses Among Nursing Staff | 0.500 (0.398) |
0.500 (0.406) |
0.500 (0.380) |
0.000 | 0.501 (0.405) |
0.501 (0.411) |
0.500 (0.392) |
-0.001 |
| Number of Beds | 20331.150 (7606.658) |
20697.730 (7722.880) |
19414.710 (7246.666) |
-1283.020 | 46016.960 (32808.440) |
46520.880 (32959.260) |
44759.900 (32484.220) |
-1760.980 |
| Share of Mental Hospitals | 0.149 (0.040) |
0.148 (0.038) |
0.154 (0.044) |
0.007 | 0.121 (0.029) |
0.120 (0.028) |
0.123 (0.030) |
0.003 |
| Share of Private Hospitals | 0.739 (0.094) |
0.741 (0.093) |
0.736 (0.097) |
-0.004 | 0.832 (0.079) |
0.832 (0.079) |
0.832 (0.078) |
-0.001 |
| Number of Hospitals | 108.301 (42.097) |
109.688 (42.613) |
104.833 (40.681) |
-4.854 | 252.442 (162.264) |
254.915 (163.203) |
246.272 (160.171) |
-8.643 |
| Outpatient Visits per 100,000 People | 5686.271 (609.001) |
5698.629 (629.628) |
5655.375 (554.443) |
-43.254 | 5757.941 (532.519) |
5769.534 (515.910) |
5729.022 (160.171) |
-40.512 |
| Share of People aged 65 or older | 0.293 (0.038) |
0.282 (0.035) |
0.321 (0.029) |
0.039 | 0.279 (0.035) |
0.270 (0.032) |
0.302 (0.032) |
0.033 |
| N | 672 | 480 | 192 | 643 | 459 | 184 | ||
Figure B1: Relationship between Nursing Shortage Measure 1 (log) and 2, by HHI Group
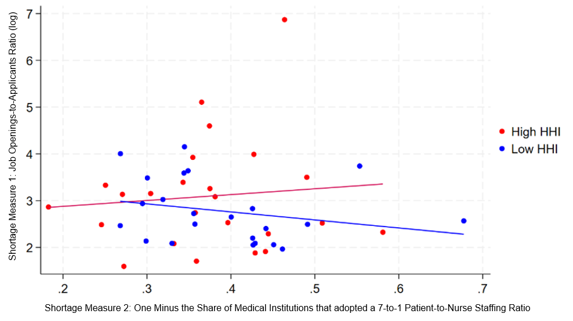
Figure B2: Prefecture-Level Maps of Changes in Scheduled Cash Earnings and Overtime Hours
Panel A: Map of Scheduled Cash Earnings (yen), 2023 minus 2019
Panel B: Map of Overtime Hours (hours), 2023 minus 2019
Appendix C. Additional Results
Table C1: Effect of Nursing Shortage Measure 1 on Log Scheduled Cash Earnings
| Log Scheduled Cash Earnings | ||||||
|---|---|---|---|---|---|---|
| (1) | (2) | (3) | (4) | (5) | (6) | |
| Nurses Shortage Measure 1 (log)×Post | -0.002 (0.023) |
0.001 (0.022) |
0.005 (0.022) |
|||
| Nursing Shortage Measure 1 (log)×Post×HHI | 0.022 (0.014) |
0.037** (0.013) |
0.035** (0.012) |
|||
| Age of Nurses (log) | 0.332*** (0.039) |
0.331*** (0.039) |
0.337*** (0.039) |
0.336*** (0.039) |
||
| Minimum Wage (log) | -0.662 (0.462) |
-0.932 (0.515) |
-0.961* (0.470) |
-1.166* (0.517) |
||
| Share of Registered Nurses Among Nursing Staff | 0.039 (0.037) |
0.040 (0.037) |
0.038 (0.038) |
0.039 (0.037) |
||
| Number of Beds (log) | -0.267 (0.230) |
-0.089 (0.265) |
-0.308 (0.211) |
-0.113 (0.250) |
||
| Share of Mental Hospitals | 0.834 (0.775) |
0.680 (0.798) |
0.631 (0.777) |
0.505 (0.798) |
||
| Share of Private Hospitals | -0.797 (0.547) |
-0.712 (0.578) |
||||
| Number of Hospitals (log) | -0.375 (0.211) |
-0.384 (0.209) |
||||
| Outpatient Visits per 100,000 People (log) | 0.020 (0.062) |
0.031 (0.062) |
||||
| Share of People aged 65 or older | 1.411 (1.768) |
1.087 (1.703) |
||||
| Intercept | 12.590*** (0.007) |
18.369*** (3.833) |
20.293*** (4.069) |
12.586*** (0.002) |
20.781*** (3.817) |
22.073*** (4.112) |
| Prefecture, gender and year fixed effects | Yes | Yes | Yes | Yes | Yes | Yes |
| Prefecture-specific linear trends | Yes | Yes | Yes | Yes | Yes | Yes |
| Gender-specific linear trends | Yes | Yes | Yes | Yes | Yes | Yes |
| N | 1315 | 1315 | 1315 | 1315 | 1315 | 1315 |
Notes: Robust standard errors in parentheses are clustered at the prefecture level. Lower-order terms are absorbed by the fixed effects and linear time trends and are therefore omitted.
* p<0.05, ** p<0.01, *** p<0.001
Table C2: Effect of Nursing Shortage Measure 1 on Log Overtime Hours
| Log Overtime Hours | ||||||
|---|---|---|---|---|---|---|
| (1) | (2) | (3) | (4) | (5) | (6) | |
| Nurses Shortage Measure 1 (log)×Post | 0.107 (0.176) |
0.038 (0.139) |
0.062 -0.139 |
|||
| Nursing Shortage Measure 1 (log)×Post×HHI | 0.050 (0.076) |
0.015 (0.068) |
0.001 (0.068) |
|||
| Age of Nurses (log) | -1.019***(0.174) | -1.023*** -0.172 |
-1.019*** (0.175) |
-1.026*** (0.173) |
||
| Minimum Wage (log) | -0.305 (3.612) |
-2.493 -4.154 |
-0.504 (3.785) |
-2.509 (4.242) |
||
| Share of Registered Nurses Among Nursing Staff | -0.468 (0.240) |
-0.466 -0.24 |
-0.468 (0.240) |
-0.465 (0.240) |
||
| Number of Beds (log) | -0.811 (2.112) |
-1.098 -2.543 |
-0.834 (2.095) |
-1.109 (2.553) |
||
| Share of Mental Hospitals | 6.057 (6.901) |
6.218 -6.98 |
6.195 (7.169) |
6.558 (7.238) |
||
| Share of Private Hospitals | -2.483 -3.388 |
-2.548 (3.351) |
||||
| Number of Hospitals (log) | -0.069 -1.598 |
-0.040 (1.617) |
||||
| Outpatient Visits per 100,000 People (log) | -0.089 -0.413 |
-0.096 (0.412) |
||||
| Share of People aged 65 or older | 11.09 -7.861 |
10.523 (7.604) |
||||
| Intercept | 1.910*** (0.052) |
15.327 (32.335) |
32.681 -35.351 |
1.934*** (0.012) |
16.874 (32.730) |
33.027 (35.518) |
| Prefecture, gender and year fixed effects | Yes | Yes | Yes | Yes | Yes | Yes |
| Prefecture-specific linear trends | Yes | Yes | Yes | Yes | Yes | Yes |
| Gender-specific linear trends | Yes | Yes | Yes | Yes | Yes | Yes |
| N | 1315 | 1315 | 1315 | 1315 | 1315 | 1315 |
Notes: Robust standard errors in parentheses are clustered at the prefecture level. Lower-order terms are absorbed by the fixed effects and linear time trends and are therefore omitted. Dependent variable is log (overtime+1).
* p<0.05, ** p<0.01, *** p<0.001
Table C3: Effect of Nursing Shortage Measure 2 on Log Earnings per Hour
| Log Earnings per Hour | ||||||
|---|---|---|---|---|---|---|
| (1) | (2) | (3) | (4) | (5) | (6) | |
| Nurses Shortage Measure 2×Post | 0.001 (0.093) |
-0.023 (0.083) |
-0.026 (0.084) |
|||
| Nursing Shortage Measure 2×Post×HHI | 0.070 (0.048) |
0.124** (0.045) |
0.115* (0.046) |
|||
| Age of Nurses (log) | 0.348*** (0.040) |
0.348*** (0.040) |
0.352*** (0.040) |
0.351*** (0.040) |
||
| Minimum Wage (log) | -0.476 (0.525) |
-0.808 (0.591) |
-0.958 (0.554) |
-1.071 (0.608) |
||
| Share of Registered Nurses Among Nursing Staff | 0.047 (0.038) |
0.047 (0.038) |
0.046 (0.038) |
0.046 (0.038) |
||
| Number of Beds (log) | -0.498* (0.241) |
-0.289 (0.281) |
-0.620* (0.238) |
-0.392 (0.292) |
||
| Share of Mental Hospitals | 1.182 (0.968) |
1.038 (0.995) |
1.072 (0.943) |
0.919 (0.978) |
||
| Share of Private Hospitals | -0.843 (0.660) |
-0.807 (0.654) |
||||
| Number of Hospitals (log) | -0.442 (0.235) |
-0.411 (0.225) |
||||
| Outpatient Visits per 100,000 People (log) | 0.022 (0.065) |
0.039 (0.061) |
||||
| Share of People aged 65 or older | 1.684 (1.801) |
0.749 (1.752) |
||||
| Intercept | 7.518*** (0.010) |
14.293*** (4.039) |
16.588*** (4.314) |
7.514*** (0.003) |
18.739*** (4.444) |
19.316*** (4.720) |
| Prefecture, gender and year fixed effects | Yes | Yes | Yes | Yes | Yes | Yes |
| Prefecture-specific linear trends | Yes | Yes | Yes | Yes | Yes | Yes |
| Gender-specific linear trends | Yes | Yes | Yes | Yes | Yes | Yes |
| N | 1315 | 1315 | 1315 | 1315 | 1315 | 1315 |
Notes: Robust standard errors in parentheses are clustered at the prefecture level. Lower-order terms are absorbed by the fixed effects and linear time trends and are therefore omitted.
* p<0.05, ** p<0.01, *** p<0.001
Table C4: Effect of Nursing Shortage Measure 2 on Log Scheduled Cash Earnings
| Log Scheduled Cash Earnings | ||||||
|---|---|---|---|---|---|---|
| (1) | (2) | (3) | (4) | (5) | (6) | |
| Nurses Shortage Measure 2×Post | -0.024 (0.083) |
-0.036 (0.082) |
-0.038 (0.077) |
|||
| Nursing Shortage Measure 2 ×Post × HHI | 0.065 (0.045) |
0.116** (0.042) |
0.109* (0.043) |
|||
| Age of Nurses (log) | 0.332*** (0.038) |
0.332*** (0.038) |
0.336*** (0.039) |
0.335*** (0.039) |
||
| Minimum Wage (log) | -0.616 (0.464) |
-0.904 (0.519) |
-1.085* (0.470) |
-1.162* (0.524) |
||
| Share of Registered Nurses Among Nursing Staff | 0.039 (0.038) |
0.040 (0.038) |
0.039 (0.038) |
0.039 (0.038) |
||
| Number of Beds (log) | -0.273 (0.217) |
-0.099 (0.254) |
-0.384 (0.220) |
-0.192 (0.264) |
||
| Share of Mental Hospitals | 0.862 (0.818) |
0.740 (0.822) |
0.751 (0.790) |
0.618 (0.808) |
||
| Share of Private Hospitals | -0.780 (0.550) |
-0.755 (0.565) |
||||
| Number of Hospitals (log) | -0.371 (0.209) |
-0.342 (0.202) |
||||
| Outpatient Visits per 100,000 People (log) | 0.019 (0.064) |
0.035 (0.061) |
||||
| Share of People aged 65 or older | 1.458 (1.746) |
0.542 (1.659) |
||||
| Intercept | 12.592*** (0.009) |
18.117*** (3.794) |
20.159*** (4.003) |
12.586*** (0.002) |
22.371*** (4.040) |
22.791*** (4.322) |
| Prefecture, gender and year fixed effects | Yes | Yes | Yes | Yes | Yes | Yes |
| Prefecture-specific linear trends | Yes | Yes | Yes | Yes | Yes | Yes |
| Gender-specific linear trends | Yes | Yes | Yes | Yes | Yes | Yes |
| N | 1315 | 1315 | 1315 | 1315 | 1315 | 1315 |
Notes: Robust standard errors in parentheses are clustered at the prefecture level. Lower-order terms are absorbed by the fixed effects and linear time trends and are therefore omitted.
* p<0.05, ** p<0.01, *** p<0.001
Table C5: Effect of Nursing Shortage Measure 2 on Log Scheduled Working Hours
| Log Scheduled Working Hours | ||||||
|---|---|---|---|---|---|---|
| (1) | (2) | (3) | (4) | (5) | (6) | |
| Nurses Shortage Measure 2×Post | -0.025 (0.058) |
-0.013 (0.048) |
-0.012 (0.050) |
|||
| Nursing Shortage Measure 2×Post×HHI | -0.005 (0.018) |
-0.008 (0.018) |
-0.006 (0.019) |
|||
| Age of Nurses (log) | -0.016 (0.009) |
-0.016 (0.009) |
-0.017 (0.009) |
-0.017 (0.009) |
||
| Minimum Wage (log) | -0.140 (0.183) |
-0.095 (0.202) |
-0.127 (0.197) |
-0.091 (0.208) |
||
| Share of Registered Nurses Among Nursing Staff | -0.007 (0.012) |
-0.007 (0.012) |
-0.007 (0.012) |
-0.007 (0.012) |
||
| Number of Beds (log) | 0.225 (0.124) |
0.191 (0.147) |
0.235 (0.127) |
0.200 (0.153) |
||
| Share of Mental Hospitals | -0.319 (0.368) |
-0.298 (0.391) |
-0.322 (0.380) |
-0.302 (0.405) |
||
| Share of Private Hospitals | 0.063 (0.220) |
0.053 (0.216) |
||||
| Number of Hospitals (log) | 0.071 (0.094) |
0.068 (0.094) |
||||
| Outpatient Visits per 100,000 People (log) | -0.003 (0.031) |
-0.004 (0.031) |
||||
| Share of People aged 65 or older | -0.226 (0.734) |
-0.208 (0.766) |
||||
| Intercept | 5.075*** (0.006) |
3.824* (1.853) |
3.571 (1.895) |
5.072*** (0.001) |
3.632 (1.856) |
3.475 (1.861) |
| Prefecture, gender and year fixed effects | Yes | Yes | Yes | Yes | Yes | Yes |
| Prefecture-specific linear trends | Yes | Yes | Yes | Yes | Yes | Yes |
| Gender-specific linear trends | Yes | Yes | Yes | Yes | Yes | Yes |
| N | 1315 | 1315 | 1315 | 1315 | 1315 | 1315 |
Notes: Robust standard errors in parentheses are clustered at the prefecture level. Lower-order terms are absorbed by the fixed effects and linear time trends and are therefore omitted.
* p<0.05, ** p<0.01, *** p<0.001
Table C6: Effect of Nursing Shortage Measure 2 on Log Overtime Hours
| Log Overtime Hours | ||||||
|---|---|---|---|---|---|---|
| (1) | (2) | (3) | (4) | (5) | (6) | |
| Nursing Shortage Measure 2×Post×HHI | 0.198 (0.270) |
0.162 (0.254) |
0.084 (0.255) |
|||
| Age of Nurses (log) | -1.022*** (0.175) |
-1.027*** (0.173) |
-1.016*** (0.174) |
-1.023*** (0.172) |
||
| Minimum Wage (log) | -0.566 (3.635) |
-2.575 (4.114) |
-0.971 (3.757) |
-2.679 (4.198) |
||
| Share of Registered Nurses Among Nursing Staff | -0.467 (0.240) |
-0.465 (0.240) |
-0.468 (0.240) |
-0.466 (0.240) |
||
| Number of Beds (log) | -0.797 (2.141) |
-1.086 (2.560) |
-0.980 (2.072) |
-1.188 (2.533) |
||
| Share of Mental Hospitals | 6.189 (7.116) |
6.490 (7.232) |
6.157 (7.259) |
6.493 (7.311) |
||
| Share of Private Hospitals | -2.606 (3.513) |
-2.513 (3.370) |
||||
| Number of Hospitals (log) | -0.043 (1.617) |
-0.017 (1.621) |
||||
| Outpatient Visits per 100,000 People (log) | -0.097 (0.409) |
-0.085 (0.416) |
||||
| Share of People aged 65 or older | 10.299 (7.891) |
9.894 (7.571) |
||||
| Intercept | 1.928*** (0.064) |
16.909 (33.539) |
33.359 (36.022) |
1.931*** (0.015) |
21.459 (32.694) |
34.889 (35.510) |
| Prefecture, gender and year fixed effects | Yes | Yes | Yes | Yes | Yes | Yes |
| Prefecture-specific linear trends | Yes | Yes | Yes | Yes | Yes | Yes |
| Gender-specific linear trends | Yes | Yes | Yes | Yes | Yes | Yes |
| N | 1315 | 1315 | 1315 | 1315 | 1315 | 1315 |
Notes: Robust standard errors in parentheses are clustered at the prefecture level. Lower-order terms are absorbed by the fixed effects and linear time trends and are therefore omitted. Dependent variable is log (overtime+1).
* p<0.05, ** p<0.01, *** p<0.001
Table C7: Effect of Nursing Shortage Measure 2 on Log Number of Workers
| Log Number of Workers | ||||||
|---|---|---|---|---|---|---|
| (1) | (2) | (3) | (4) | (5) | (6) | |
| Nurses Shortage Measure 2×Post | 0.092 (0.479) |
-0.017 (0.445) |
-0.066 (0.375) |
|||
| Nursing Shortage Measure 2 ×Post×HHI | 0.106 (0.230) |
0.111 (0.225) |
0.111 (0.216) |
|||
| Age of Nurses (log) | 0.219 (0.146) |
0.209 (0.145) |
0.222 (0.147) |
0.212 (0.146) |
||
| Minimum Wage (log) | 2.458 (3.147) |
0.997 (3.059) |
2.033 (3.188) |
0.712 (3.090) |
||
| Share of Registered Nurses Among Nursing Staff | 5.458*** (0.216) |
5.463*** (0.215) |
5.457*** (0.216) |
5.462*** (0.215) |
||
| Number of Beds (log) | -0.981 (1.612) |
-3.597 (1.992) |
-1.090 (1.589) |
-3.685 (1.926) |
||
| Share of Mental Hospitals | 2.065 (4.911) |
4.213 (4.428) |
1.970 (4.923) |
4.067 (4.457) |
||
| Share of Private Hospitals | -0.100 (3.154) |
-0.090 (3.126) |
||||
| Number of Hospitals (log) | 4.079** (1.348) |
4.107** (1.329) |
||||
| Outpatient Visits per 100,000 People (log) | -0.140 (0.343) |
-0.124 (0.347) |
||||
| Share of People aged 65 or older | 7.292 (9.566) |
6.291 (9.732) |
||||
| Intercept | 8.033*** (0.052) |
-2.172 (25.497) |
12.848 (23.727) |
8.038*** (0.013) |
1.764 (26.079) |
15.641 (24.358) |
| Prefecture, gender and year fixed effects | Yes | Yes | Yes | Yes | Yes | Yes |
| Prefecture-specific linear trends | Yes | Yes | Yes | Yes | Yes | Yes |
| Gender-specific linear trends | Yes | Yes | Yes | Yes | Yes | Yes |
| N | 1315 | 1315 | 1315 | 1315 | 1315 | 1315 |
Notes: Robust standard errors in parentheses are clustered at the prefecture level. Lower-order terms are absorbed by the fixed effects and linear time trends and are therefore omitted.
* p<0.05, ** p<0.01, *** p<0.001
Figure C1: Event-Study Estimates of the Effect of Nursing Shortage on Log Earnings per Hour
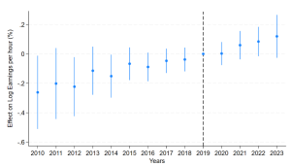
Panel A: Event Study: Effect of Nursing Shortage Measure 1 on Log Earnings per Hour
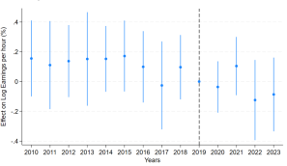
Panel B: Event Study: Effect of Nursing Shortage Measure 2 on Log Earnings per Hour
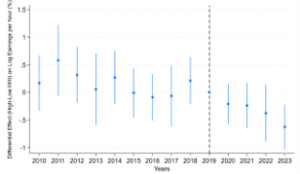
Panel C: Event Study: Differential Effect of Nursing Shortage Measure 2 on Log Earnings per Hour by Market Concentration (High vs Low HHI)
Notes: Estimates include prefecture, year, and gender fixed effects, as well as prefecture- and gender- specific linear time trends. The omitted reference year is 2019. Standard errors are clustered at the prefecture level.
Wald F-test
- Panel A: F(9, 46) = 1.47, p = 0.186
- Panel B: F(9, 46) = 1.43, p = 0.202
- Panel C: F(9, 46) = 1.02, p = 0.442
Figure C2: Event-Study Estimates of the Effect of Nursing Shortage on Log Scheduled Cash Earnings
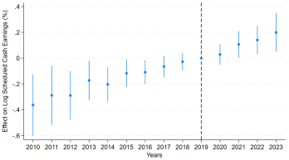
Panel A: Event Study: Effect of Nursing Shortage Measure 1
on Log Scheduled Cash Earnings
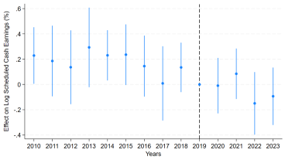
Panel B: Event Study: Effect of Nursing Shortage Measure 2
on Log Scheduled Cash Earnings
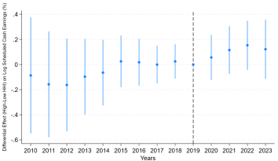
Panel C: Event Study: Differential Effect of Nursing Shortage Measure 1 on Log Scheduled Cash Earnings by Market Concentration (High vs Low HHI)
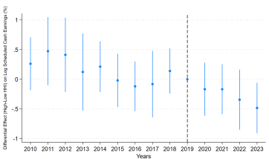
Panel D: Event Study: Differential Effect of Nursing Shortage Measure 2 on Log Scheduled Cash Earnings by Market Concentration
(High vs Low HHI)
Notes: Estimates include prefecture, year, and gender fixed effects, as well as prefecture- and gender- specific linear time trends. The omitted reference year is 2019. Standard errors are clustered at the prefecture level.
Wald F-test
- Panel A: F(9, 46) = 2.63, p = 0.015
- Panel B: F(9, 46) = 3.82, p = 0.001
- Panel C: F(9, 46) = 1.77, p = 0.100
- Panel D: F(9, 46) = 1.24, p = 0.296
Figure C3: Event-Study Estimates of the Effect of Nursing Shortage on Log Scheduled Working Hours
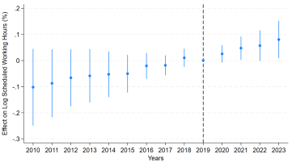
Panel A: Event Study: Effect of Nursing Shortage Measure 1 on Log Scheduled Working Hours
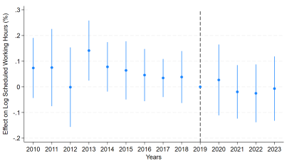
Panel B: Event Study: Effect of Nursing Shortage Measure 2 on Log Scheduled Working Hours
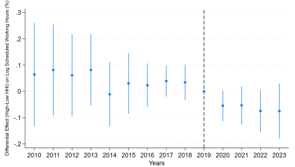
Panel C: Event Study: Differential Effect of Nursing Shortage Measure 1 on Log Scheduled Working Hours by Market Concentration (High vs Low HHI)
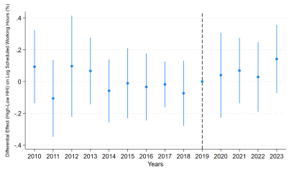
Panel D: Event Study: Differential Effect of Nursing Shortage Measure 2 on Log Scheduled Working Hours by Market Concentration (High vs Low HHI)
Notes Panel A & B: Estimates include prefecture, year, and gender fixed effects, as well as prefecture- and gender- specific linear time trends. The omitted reference year is 2019. Standard errors are clustered at the prefecture level.
Notes Panel C & D: Estimates include prefecture, year, and gender fixed effects, as well as prefecture- and gender- specific linear time trends. The specification also includes all lower-order terms of the triple interaction to reduce potential confounding and to assess the pre-trends transparently. The omitted reference year is 2019. Standard errors are clustered at the prefecture level.
Wald F-test
- Panel A: F(9, 46) = 1.01, p = 0.443
- Panel B: F(9, 46) = 1.19, p = 0.321
- Panel C: F(9, 46) = 2.74, p = 0.012
- Panel D: F(9, 46) = 0.98, p = 0.467
Figure C4: Event-Study Estimates of the Effect of Nursing Shortage on Log Overtime Hours
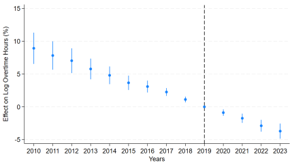
Panel A: Event Study: Effect of Nursing Shortage Measure 1 on Log Overtime Hours
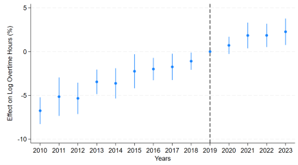
Panel B: Event Study: Effect of Nursing Shortage Measure 2 on Log Overtime Hours
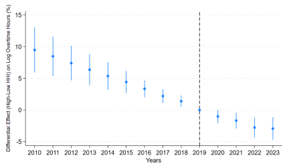
Panel C: Event Study: Differential Effect of Nursing Shortage Measure 1 on Log Overtime Hours by Market Concentration (High vs Low HHI)
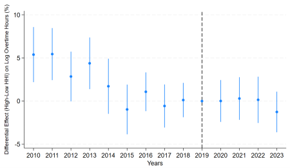
Panel D: Event Study: Differential Effect of Nursing Shortage Measure 2 on Log Overtime Hours by Market Concentration (High vs Low HHI)
Notes Panel A & B: Estimates include prefecture, year, and gender fixed effects, as well as prefecture- and gender- specific linear time trends. The omitted reference year is 2019. Standard errors are clustered at the prefecture level. The dependent variable is transformed to log (overtime+1).
Notes Panel C & D: Estimates include prefecture, year, and gender fixed effects, as well as prefecture- and gender- specific linear time trends. The specification also includes all lower-order terms of the triple interaction to reduce potential confounding and to assess the pre-trends transparently. The omitted reference year is 2019. Standard errors are clustered at the prefecture level. The dependent variable is transformed to log (overtime+1).
Wald F-test
- Panel A: F(9, 46) = 9.08, p = 0.000
- Panel B: F(9, 46) = 9.85, p = 0.000
- Panel C: F(9, 46) = 3.70, p = 0.002
- Panel D: F(9, 46) = 5.72, p = 0.00
Figure C5: Event-Study Estimates of the Effect of Nursing Shortage on Log Number of Workers
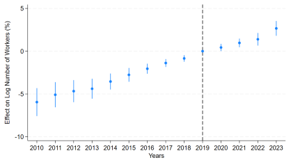
Panel A: Event Study: Effect of Nursing Shortage Measure 1 on Log Number of Workers
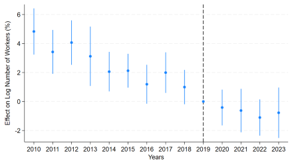
Panel B: Event Study: Effect of Nursing Shortage Measure 2 on Log Number of Workers
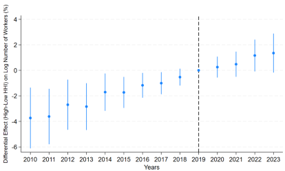
Panel C: Event Study: Differential Effect of Nursing Shortage Measure 1 on Log Number of Workers by Market Concentration
(High vs Low HHI)
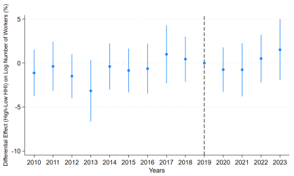
Panel D: Event Study: Differential Effect of Nursing Shortage Measure 2 on Log Number of Workers by Market Concentration
(High vs Low HHI)
Notes Panel A & B: Estimates include prefecture, year, and gender fixed effects, as well as prefecture- and gender- specific linear time trends. The omitted reference year is 2019. Standard errors are clustered at the prefecture level.
Notes Panel C & D: Estimates include prefecture, year, and gender fixed effects, as well as prefecture- and gender- specific linear time trends. The specification also includes all lower-order terms of the triple interaction to reduce potential confounding and to assess the pre-trends transparently. The omitted reference year is 2019. Standard errors are clustered at the prefecture level.
Wald F-test
- Panel A: F(9, 46) = 8.59, p = 0.000
- Panel B:F(9, 46) = 6.36, p = 0.000
- Panel C: F(9, 46) = 2.47, p = 0.022
- Panel D: F(9, 46) = 2.87, p = 0.01
Appendix D. Robustness Checks
Table D1: Effect of Nursing Shortage Measure 1 on Log Earnings per Hour
(High-HHI: Top Tercile, Low-HHI: Bottom Tercile)
| Log Earnings per Hour | |||
|---|---|---|---|
| (1) | (2) | (3) | |
| Nursing Shortage Measure 1 (log)×Post×HHI | 0.022 (0.019) |
0.050** (0.015) |
0.051** (0.016) |
| Age of Nurses (log) | 0.364*** (0.037) |
0.361*** (0.038) |
|
| Minimum Wage (log) | -1.001 (0.614) |
-0.964 (0.694) |
|
| Share of Registered Nurses Among Nursing Staff | 0.086 (0.053) |
0.087 (0.053) |
|
| Number of Beds (log) | -0.758** (0.266) |
-0.668** (0.223) |
|
| Share of Mental Hospitals | 0.286 (0.767) |
-0.038 (0.900) |
|
| Share of Private Hospitals | -1.086 (0.911) |
||
| Number of Hospitals (log) | -0.327 (0.292) |
||
| Outpatient Visits per 100,000 People (log) | 0.037 (0.071) |
||
| Share of People aged 65 or older | 0.074 (2.376) |
||
| Intercept | 7.520*** (0.003) |
20.514*** (4.628) |
21.543*** (5.040) |
| Prefecture, gender and year fixed effects | Yes | Yes | Yes |
| Prefecture-specific linear trends | Yes | Yes | Yes |
| Gender-specific linear trends | Yes | Yes | Yes |
| N | 868 | 868 | 868 |
Notes: Robust standard errors in parentheses are clustered at the prefecture level. Lower-order terms are absorbed by the fixed effects and linear time trends and are therefore omitted.
* p<0.05, ** p<0.01, *** p<0.001
Table D2: Effect of Nursing Shortage Measure 1 on Log Earnings per Hour
(Two-Way Clustered at the prefecture and year level)
| Log Earnings per Hour | ||||
|---|---|---|---|---|
| (1) | (2) | (3) | ||
| Nursing Shortage Measure 1 (log)×Post×HHI | 0.027 (0.020) |
0.041* (0.015) |
0.040* (0.015) |
|
| Age of Nurses (log) | 0.354*** (0.033) |
0.353*** (0.034) |
||
| Minimum Wage (log) | -0.843 (0.462) |
-1.092 (0.592) |
||
| Share of Registered Nurses Among Nursing Staff | 0.045 (0.031) |
0.046 (0.032) |
||
| Number of Beds (log) | -0.540 (0.305) |
-0.310 (0.346) |
||
| Share of Mental Hospitals | 0.932 (1.115) |
0.785 (1.088) |
||
| Share of Private Hospitals | -0.755 (0.571) |
|||
| Number of Hospitals (log) | -0.456 (0.232) |
|||
| Outpatient Visits per 100,000 People (log) | 0.037 (0.066) |
|||
| Share of People aged 65 or older | 1.306 (1.588) |
|||
| Intercept | 7.514*** (0.003) |
17.177*** (2.162) |
18.685*** (2.688) |
|
| Prefecture, gender and year fixed effects | Yes | Yes | Yes | |
| Prefecture-specific linear trends | Yes | Yes | Yes | |
| Gender-specific linear trends | Yes | Yes | Yes | |
| N | 1315 | 1315 | 1315 | |
Notes: Robust standard errors in parentheses are two-way clustered at the prefecture and year level. Lower-order terms are absorbed by the fixed effects and linear time trends and are therefore omitted.
* p<0.05, ** p<0.01, *** p<0.001
Table D3: Placebo Test of the Effect of Nursing Shortage Measure 1 on Log Earnings per Hour
(Placebo Post=2017, Placebo Post=2018)
| Log Earnings per Hour | ||||||
|---|---|---|---|---|---|---|
| (Post=2017) | (Post=2018) | |||||
| (1) | (2) | (3) | (4) | (5) | (6) | |
| Nursing Shortage Measure 1 (log)×Post×HHI | 0.004 (0.014) |
0.002 (0.012) |
0.004 (0.012) |
0.025 (0.018) |
0.026 (0.017) |
0.028 (0.016) |
| Age of Nurses (log) | 0.348*** (0.040) |
0.347*** (0.040) |
0.348*** (0.040) |
0.347*** (0.040) |
||
| Minimum Wage (log) | -0.514 (0.522) |
-0.836 (0.580) |
-0.653 (0.535) |
-0.931 (0.586) |
||
| Share of Registered Nurses Among Nursing Staff | 0.047 (0.038) |
0.047 (0.038) |
0.047 (0.038) |
0.047 (0.038) |
||
| Number of Beds (log) | -0.496* (0.244) |
-0.281 (0.284) |
-0.499* (0.236) |
-0.250 (0.280) |
||
| Share of Mental Hospitals | 1.157 (0.943) |
0.998 (0.968) |
1.070 (0.933) |
0.880 (0.968) |
||
| Share of Private Hospitals | -0.858 (0.650) |
-0.855 (0.649) |
||||
| Number of Hospitals (log) | -0.448 (0.232) |
-0.496* (0.232) |
||||
| Outpatient Visits per 100,000 People (log) | 0.022 (0.065) |
0.025 (0.063) |
||||
| Share of People aged 65 or older | 1.599 (1.825) |
1.367 (1.815) |
||||
| Intercept | 7.517*** (0.004) |
14.525*** (4.002) |
16.767*** (4.277) |
7.512*** (0.004) |
15.496*** (4.080) |
17.368*** (4.309) |
| Prefecture, gender and year fixed effects | Yes | Yes | Yes | Yes | Yes | Yes |
| Prefecture-specific linear trends | Yes | Yes | Yes | Yes | Yes | Yes |
| Gender-specific linear trends | Yes | Yes | Yes | Yes | Yes | Yes |
| N | 1315 | 1315 | 1315 | 1315 | 1315 | 1315 |
Notes: Robust standard errors in parentheses are clustered at the prefecture level. Lower-order terms are absorbed by the fixed effects and linear time trends and are therefore omitted.
* p<0.05, ** p<0.01, *** p<0.001
Ⅸ. References
- Aiken, L. H., Clarke, S. P., Sloane, D. M., Sochalski, J., & Silber, J. H. (2002). Hospital nurse staffing and patient mortality, nurse burnout, and job dissatisfaction. JAMA, 288(16), 1987–1993. https://doi.org/10.1001/jama.288.16.1987
- Cabinet Office. (2019). 7:1 10:1 Nyuin kihonryou no taiou ni tsuite [Regarding the 7:1 and 10:1 hospitalization fee]. https://www5.cao.go.jp/keizai-shimon/kaigi/special/reform/wg1/291128/sankou1-2.pdf
- de Cordova, P. B., Reilly, L. L., Pogorzelska-Maziarz, M., Gerolamo, A. M., Grafova, I., Vasquez, A., & Johansen, M. L. (2024). A theoretical framework for acute care nurse stress appraisal: Application of the transactional model of stress and coping. Journal of Advanced Nursing, 80, 3835–3845. https://doi.org/10.1111/jan.16061
- Director General for Policy Coordination, Cabinet Office. (2017). Kouritsu byouin no joukyou to shoukibo kouritsu byouin no keiei kadai [Current state of public hospital management and management issues of small public hospitals]. https://www5.cao.go.jp/keizai3/2017/08seisakukadai12-0.pdf
- Han, K. T., & Kim, S. (2025). Impact of COVID-19 on nurse staffing levels and healthcare-associated infections in medical institutions: A retrospective cohort study. Scientific Reports, 15, 13351. https://doi.org/10.1038/s41598-025-97660-6
- Hirsch, B. T., & Schumacher, E. J. (2005). Classic or new monopsony? Searching for evidence in nursing labor markets. Journal of Health Economics, 24(5), 969–989. https://doi.org/10.1016/j.jhealeco.2005.03.006
- Japan Medical Association. (2025). Shisetsubetsu kensaku [Search by facilities]. Japan Medical Analysis Platform. Retrieved December 15, 2025, from https://jmap.jp/facilities/search
- Japan Medical Workers Union. (2023). 2022 nen kangoshokuin no roudou jittai chousa “houkokusyuu” [2022 Nursing staff labor survey report]. Retrieved January 11, 2026, from http://irouren.or.jp/research/a45cbfdb78bdf6ad5d567906ca9cdc1b715e72b4.pdf
- Japanese Nursing Association. (2021). Korona-ka ni okeru kangoshokuin no genjou to kadai: Daihachiji iryou keikaku ni kansuru Nihon Kango Kyokai no teian [Current situation and challenges of securing nursing staff during the COVID-19: Proposal by the Japanese Nursing Association regarding the 8th medical care plan]. https://www.mhlw.go.jp/content/10800000/000851588.pdf
- Japan System Techniques Co., Ltd. (n.d.). Data profile: REZULT. Retrieved January 11, 2026, from https://www.rezult-lp.com/data/
- Kaneda, A., Tsunashima, R., Maruyama, Y., Arimoto, A., Doi, M., Minamizaki, M., Akiyama, T., & Kanoya, Y. (2025). Securing nursing staff during COVID-19 outbreak in Japan: Efforts in normal times and during an outbreak. Journal of the Japan Academy of Nursing Administration and Policies, 29(1), 94–105. https://doi.org/10.19012/janap.29.1_94
- Kobayashi, M., Igarashi, A., & Ikeda, S. (2020). Aratana kangoshokuin no hatarakikata ni taioushita kangoshokuin juyou suikei e no eikyou youin to ebidensu no kenshou ni tsuite no kenkyuu [Research on factors influencing the estimation of nursing staff supply and demand in response to new nursing staff working styles and the verification of evidence research report]. Ministry of Health, Labour, and Welfare. https://mhlw-grants.niph.go.jp/system/files/report_pdf/202022038A-buntan1.pdf
- Matsudaira, J. D. (2014). Monopsony in the low-wage labor market? Evidence from minimum nurse staffing regulations. The Review of Economics and Statistics, 96(1), 92–102. https://www.jstor.org/stable/43554915
- Ministry of Health, Labour, and Welfare. (2021). Kangoshokuintou shoguu kaizen jigyou hojokin no gaiyou [Overview of the subsidy for improving the treatment of nursing staff]. https://www.mhlw.go.jp/content/000876922.pdf
- Ministry of Health, Labour, and Welfare. (2023). Shingata Korona Uirusu kansenshou no shinryouhoushuujou no toriatsukai ni tsuite [Regarding medical fee treatment for COVID-19]. https://www.mhlw.go.jp/content/12404000/001145460.pdf
- Ministry of Health, Labour, and Welfare. (2024). Reiwa 6nendo shinryou houshuu kaitei no gaiyou: Chinage/kihonryoutou no hikiage [Overview of the FY2024 medical fee revision: Wage increases, basic fee increases, etc.]. https://www.mhlw.go.jp/content/12400000/001251534.pdf
- Ministry of Health, Labour, and Welfare. (2025a). Basic survey on wage structure (Chingin Kouzou Kihon Toukei Chousa) [Data set]. e-Stat. Retrieved August 20, 2025, from https://www.e-stat.go.jp/stat-search/files?page=1&toukei=00450091&tstat=000001011429
- Ministry of Health, Labour, and Welfare. (2025b). Survey of Medical Institutions (Iryousisetsu Chousa) [Data set]. e-Stat. Retrieved October 25, 2025, from https://www.e-stat.go.jp/stat-search/files?page=1&toukei=00450021&tstat=000001030908
- Ministry of Health, Labour, and Welfare. (2025c). Survey of Patient (Kanja Chousa) [Data set]. e-Stat. Retrieved October 25, 2025, from https://www.e-stat.go.jp/stat-search/files?page=1&toukei=00450022
- Ministry of Health, Labour, and Welfare. (2025d). Chiiki betsu saitei chingin no zenkoku ichiran [Nationwide list of regional minimum wages]. Retrieved October 25, 2025, from https://www.mhlw.go.jp/stf/seisakunitsuite/bunya/koyou_roudou/roudoukijun/minimumichiran/index.html
- Ministry of Health, Labour, and Welfare, Medical Affairs Bureau, Nursing Department. (2011). Kangoshokuin shuugyou joukyou tou jittai chousa [Survey results on nursing staff employment status]. https://www.mhlw.go.jp/content/10805000/001576925.pdf
- Ministry of Health, Labour and Welfare, Health Insurance Bureau, Medical Affairs Bureau. (2018). Heisei 30nendo shinryou houshu kaitei no gaiyou Ika I [Overview of FY2018 medical fee revisions: Medical I]. https://www.mhlw.go.jp/file/06-Seisakujouhou-12400000-Hokenkyoku/0000198532.pdf
- Ministry of Health, Labour, and Welfare, Insurance Bureau. (2017). Gutaitekina kentou no “shiten” ni oite shimeshita kentou koumoku no genjou tou [Current status of the items under consideration, as outlined in the “perspectives” of specific considerations]. https://www.mhlw.go.jp/file/05-Shingikai-12601000-Seisakutoukatsukan-Sanjikanshitsu_Shakaihoshoutantou/0000176593.pdf
- Ministry of Health, Labour, and Welfare, Medical Affairs Bureau. (2022). Reiwa 4nendo shinryou hoshuu kaitei no gaiyou: Kango ni okeru shoguu kaizen [Overview of the FY2022 medical fee revision: Improving treatment in nursing]. https://www.mhlw.go.jp/content/12404000/000983969.pdf
- Ministry of Health, Labour, and Welfare, Medical Affairs Bureau, Nursing Department. (2019). Iryoujuujisha no jukyu ni kansuru kentoukai: Kangoshokuin jukyu bunkakai chuukan torimatome [Interim report of nursing staff supply and demand, subcommittee of the study group on the supply and demand of medical professionals]. https://www.mhlw.go.jp/content/10805000/000567572.pdf
- Ministry of Health, Labour, and Welfare, Medical Affairs Bureau, Nursing Department. (2023). Kangoshi (kangoshokuin) no kakuho wo meguru joukyou [The situation regarding securing nurses (nursing staff)]. https://www.mhlw.go.jp/content/10800000/001118192.pdf
- Ministry of Internal Affairs and Communications (2025). Jinkou Suikei [Population Estimates]. https://www.stat.go.jp/data/jinsui/
- (n.d.-a). Hospital beds by function of healthcare. Retrieved September 22, 2025, from https://data-viewer.oecd.org/?chartId=c9cf2c57-2dd2-4542-b48e-d78b98a8cc4b
- (n.d.-b). Nurses. Retrieved September 22, 2025, from https://data-viewer.oecd.org/?chartId=838cf889-fb9a-4ef2-bc9e-5142871242d3
- Prime Minister’s Office. (2016). Iryou kaigo: Seikatsusha no kurashi wo yutaka ni kaigou [Medical care and nursing: Enriching the lives of people meeting]. https://warp.ndl.go.jp/info:ndljp/pid/14435483/www.kantei.go.jp/jp/singi/keizaisaisei/miraitoshikaigi/suishinkaigo_iryokaigo_dai2/gijiyousi.pdf
- Sullivan, D. (1989). Monopsony power in the market for nurses. The Journal of Law & Economics, 32(2), S135–S178. https://www.jstor.org/stable/725594
- Yett, D. E. (1970). The “chronic shortage” of nurses: A public policy dilemma. In H. Klarman & H. Jaszi (Eds.), Empirical studies in health economics (pp. 357–389). Johns Hopkins University Press.