Volume 35: Paper 4
The Cost of Loadshedding on the South African Economy
Demi-Lee Carlisle
Minnesota State University Moorhead
Loadshedding refers to the deliberate and scheduled shutdown of electricity in specific areas to prevent overloading the power grid. While such outages occur in several countries, these occurrences are most common in South Africa (SA). Eskom, the country’s state-owned and monopolistic electricity supplier, has neglected routine maintenance of power station infrastructure as a necessary strategy for preserving artificially low electricity prices. As a result, the quantity of electricity supplied by Eskom has not kept pace with the nation’s increasing demand for electricity. In 2007, South Africans experienced their first of multiple scheduled power outages. Walsh et al. (2020) estimated that the country lost R34.5 billion (approximately $1.9 billion[1]) in economic activity between 2007 and 2019 due to these outages. Since the COVID-19 pandemic, the severity and frequency of loadshedding have both worsened. This paper updates the estimate by calculating the additional economic loss from loadshedding between 2020 and 2024.
While several studies have estimated the economic cost of loadshedding in other countries, these analyses focus on shorter timeframes. This paper follows the methodology used by Walsh et al. (2020) in Nova Economics, who also examined a multi-year time span. Although, our approaches are similar, the method used to calculate the magnitude of loadshedding differs. Within a classic linear regression model (CLRM), I employ data from the South African Reserve Bank (SARB) and Eskom’s data portal. The results from the regression are then used to estimate the potential monetary losses associated with loadshedding. Based on this updated research, loadshedding poses long-term risks to SA’s Gross Domestic Product (GDP). These risks include deterred foreign and domestic investment, a reduced customer base as consumers turn to alternative energy sources (such as solar and generators), declining revenues for Eskom, and weakening political accountability. This paper highlights the significant and continued economic loss caused by loadshedding.
The paper is structured into six sections. Part I explains the causes of loadshedding and the associated costs. Part II reviews existing literature and compares alternative modeling approaches used to estimate the cost of loadshedding. Part III visualises the electricity deficit and the broader implications loadshedding has on the economy. Part IV describes the data sources and variables used in the analysis. Part V presents the results and limitations of the research, and Part VI concludes with a summary of the findings.
[1] Values are converted to US dollars using the 2024 average USD/ZAR exchange rate (R18.326 per USD), based on data from the South African Reserve Bank, and used throughout the paper.
I. Background
A. Loadshedding Defined
In October 2007, South Africans across the country experienced the first of an ongoing series of scheduled electrical blackouts known as loadshedding. This energy management strategy refers to the deliberate shutdown of the electricity supply to different localities in a controlled manner. Outages are normally scheduled in two-to-four-hour blocks depending on the magnitude of the supply deficit (Western Cape Government 2019, 2). When electricity demand exceeds what the supplier can provide, the grid is at risk of becoming unstable. Sustained excess demand strains the grid since reduced generation further impacts remaining power stations, potentially contributing to a nationwide blackout. Loadshedding mitigates the strain by rotating the power outages from different localities until demand decreases and the grid stablises.
The primary power supplier, Eskom, is one of SA’s 700 state-owned enterprises (SOEs) and supplies 95 percent of the country’s energy. In addition to its domestic market, Eskom exports electricity to multiple nations including its neighbours (Botswana, Lesotho, Mozambique, and Namibia). Eskom was established in 1923 to leverage the country’s coal resources and expand its energy capacity, with the goal of fostering economic growth (UN ECA 2021). However, in recent years, Eskom has come under scrutiny for mismanagement and corruption which has undermined its ability to provide a stable energy supply (Kessides 2020). In response, South Africans developed an app providing real-time loadshedding schedule updates to inform users when loadshedding will occur in their area and how long it will last. This app helps households and firms plan ahead and manage disruptions more effectively (EskomSePush).
The resultant energy crisis in SA could have been avoided. In 1998, the Department of Minerals and Energy (DME) warned Eskom that its existing generation capacity would be fully utilised by approximately 2007, and recommended implementation strategies (energy mix diversification and renewable energy investment) to supply the country’s electricity demands for the upcoming decade (Department of Minerals and Energy 1998, 53). The report also highlighted the importance of encouraging private sector investment, such as independent power producers (IPPs), to help alleviate financial strain and the growing demand for electricity burdening Eskom. In response to these warnings, Eskom added only two coal-fired power stations since 2007. Construction of the country’s newest coal plants, Medupi and Kusile, began in 2007. In the presence of building delays, the final unit of Kusile was commissioned in September 2025 (Aiku 2025).
Electricity prices were once subsidised to improve affordability for low-income households, but this practice was discontinued. The National Energy Regulator of South Africa (NERSA) approves the electricity tariffs that Eskom charges consumers for usage. Between 1998 and 2008, electricity tariffs increased by 223 percent, while inflation rose by 335 percent (Moolman 2022). Post-loadshedding Eskom was unable to subsidise low prices. Between 2007 and 2022, electricity tariffs increased 653 percent while inflation rose 129 percent (Moolman 2022). While Eskom faced rising operational costs, such as the need for infrastructure investment and maintenance, its debt continued to grow. By the end of 2023, SA’s government provided Eskom with debt relief totaling R254 billion (approximately $13.9 billion) (Roelf 2023).
B. Frequency and Implications of Loadshedding
Prior to 2020, Nova Economics identified three periods of loadshedding (outlined in Appendix A) and calculated a magnitude of 3,921 GWh shed (Walsh et al. 2020, 3). However, a fourth and consequential period of loadshedding occurred between January 2020 and March 26, 2024. South Africans experienced loadshedding during 43 of those 51 months (Otter 2024). While the frequency of loadshedding is observable, the magnitude of loadshedding can only be estimated (see section 5.A).
Loadshedding is implemented in different stages depending on the severity of the demand deficit. Eskom has an 8-stage system, representing increasing levels of electricity conservation (Eskom). Each stage corresponds to how many megawatts (MW) must be shed to avoid overloading the grid. For example, during Stage 1, Eskom sheds 1000 MW of electricity consumption. Stage 8, which requires 8000 MW to be shed, has never been implemented. Table 1 presents the number of days each stage of loadshedding occurred between 2020 and 2024.
Table 1: The frequency of the different stages of loadshedding, 2020 to 2024, measured in days
| Stage 1 | Stage 2 | Stage 3 | Stage 4 | Stage 5 | Stage 6 | Total | |
|---|---|---|---|---|---|---|---|
| 2020 | 4.9 | 24.9 | 1.9 | 3.5 | 0 | 0 | 35.2 |
| 2021 | 3.0 | 38.1 | 2.9 | 4.0 | 0 | 0 | 48.0 |
| 2022 | 7.9 | 58.0 | 26.9 | 43.8 | 12.4 | 8.3 | 157.3 |
| 2023 | 26.0 | 40.0 | 74.9 | 81.8 | 22.5 | 44.3 | 289.5 |
| 2024 | 5.9 | 36.8 | 17.5 | 5.6 | 1.7 | 1.5 | 69.0 |
Source: Retrieved from The Outlier “Loadshed” (2024).
These data are calculated to represent full 24-hour days instead of counting a calendar day at which each stage occurred. For example, stage 1 loadshedding took place for a total of 72 hours in 2021 (equivalent to three full days). As shown in Table 1, loadshedding was most severe in 2023. The average stage of loadshedding was 4 for 335 days (91.8 percent of the year) (Otter 2024). In this context, consumers could expect power to be shed up to twelve times over a four-day period for two hours per incident or twelve times over an eight-day period for four hours per incident (Western Cape Government 2019, 3).
Not all SA power outages are scheduled. An unscheduled power outage occurs when there is a local disconnect in the transmission or distribution grid causing a network overload. There are several causes for this, such as bad weather, faulty or illegal connections, and cable theft (Allos 2023).
The primary difference to consumers is how they are able to mitigate the outage. Unscheduled outages are infrequent and happen sporadically, so most consumers do not anticipate them, and thus do not possess backup resources. As loadshedding began increasing in 2022, solar adoption increased. In two years, the amount of solar energy being installed grew by 453 percent (Bourdin 2024). This surge was incentivised by the introduction of a solar tax rebate by the South African Revenue Services (SARS) from March 2023 to February 2024. The rebate prompted individual taxpayers to install solar panels and claim 25 percent of the cost (SARS 2024). In 2024, SA was projected to become the 10th largest photovoltaic market in the world (Bourdin 2024). Those who can afford alternative power suppliers, such as generators or solar panels, are now better equipped to handle both scheduled and unscheduled power outages. The downside is the energy inequality that is emerging relative to South Africans’ income levels.
C. Cost of Loadshedding on the Economy
The United Nations, Sustainable Development Goal 7 (SDG), aims to ensure access to “affordable, reliable, sustainable and modern energy for all” by 2030. The absence of reliable electricity not only negatively affects economic growth in developing nations, but also impacts consumers by making access to reliable electricity a critical service (World Bank Group 2018).
Previous studies have shown that consumers incur both direct and indirect costs in the short-to-medium term due to power outages. Namely, direct costs are incurred when loadshedding has an immediate effect on a person or firm’s ability to complete tasks. These costs, mostly borne by firms, include loss of production, opportunity cost of idle resources, shutdown and restart expenses, and inventory and equipment damage. There are also often issues such as spoilage, data loss, and system corruption that are also incurred by firms. In contrast, indirect costs affect the broader value chain and are often absorbed by customers and suppliers. For instance, a manufacturing shutdown that delays delivery of raw materials, disrupts other firms’ production schedules and delays the receiving and consumption of goods and services by consumers (Walsh et al. 2020, 12).
As the cost of electricity continues to rise and loadshedding persists, IPPs along with firms and households installing solar panels could pose long-term threats to Eskom by reducing demand on the national grid. Although this may offer short-term relief by easing pressure on electricity production, this strategy may create financial risks as Eskom’s customer base and revenues decline.
Beyond Eskom’s financial challenges, the overall indirect costs to SA’s economy are even more challenging to quantify. Ongoing loadshedding may deter both foreign and domestic investors, making the amount of lost and delayed investment as well as its long-term impact on SA’s GDP growth difficult to measure. Insights from the literature follow in the next section.
II. Literature Review
Previous studies have attempted to estimate the impact of loadshedding both globally and locally. This section considers alternative methods used to quantify the economic loss.
Loadshedding is not a new phenomenon as the first use of the word was coined by The Times in 1947 to describe “if the saving that was essential was not forthcoming the company would have to resort to load shedding or temporary cuts in supply” (OED). While SA is most known for loadshedding, it is not unique to the country. Other nations from Zimbabwe to the US and Australia have also experienced loadshedding (Ndlovu 2024).
Two studies utilised a Computable General Equilibrium (CGE) model to quantify the impact of loadshedding. It is a well-recognised analysis that simulates the behaviour of households, government, and firms to changes in price, wages, and production. In SA, Erero (2023) revealed that leading industries that rely heavily on electricity, such as agriculture and mining, experience significant GDP contractions when ongoing power outages persist. In Nepal, Timilsina et al. (2018) studied the economic losses of the power outages between 2008 and 2016. Nepalese outages were partly due to the lack of foreign and domestic investment in infrastructure. These authors used the percentage deficit of electricity demand to calculate the monetary value of lost electricity sales due to power outages. During this period, Nepal’s economy lost $14.5 million or 6 percent of its GDP. Loadshedding also caused a 48 percent decrease in the country’s annual investment, specifically in the industrial sector. These studies show that the lack of electricity can have devasting economic effects on the most productive sectors of developing countries.
Beyond macroeconomic analyses, other studies have focused on the local impact by specifically examining consumers and individual industrial sectors. Abbas (2016) estimated the direct and adjustment costs of power outages in the small-scale manufacturing sector and Pasha and Saleem (2013) calculated the cost of loadshedding to domestic consumers in Pakistan. Both studies used a quantitative research approach that generates cost estimates associated with direct and adjustment costs. These studies favour enhancing the electricity supply since power outages are detrimental to both domestic consumers and manufacturing industries.
Menati and Xie (2021) and Wu et al. (2022) analysed the impact of the February 2021 Texas winter storm which led to widespread loadshedding on its power grid. Both studies used a simulation-based model on a realistic energy grid to recommend potential solutions to mitigate loadshedding in response to extreme weather conditions, generation failures and high demand. While Menati and Xie (2021) were interested in supply-side solutions (comparing the 2021 outages with past outages that occurred due to extreme weather in 1989 and 2011), Wu et al. (2022) focused on the demand-side and recongised how consumer flexibility could have reduced the severity of the blackout. Their analysis showed that having 5-15 GW of demand flexibility could have reduced loadshedding by 20-60 percent which would have prevented considerable hours of power outages for consumers (Wu et al. 2022).
Musabayana (2022) and Olajuyin and Mago (2022) studied the impact loadshedding had on the performance of small and medium enterprises (SMEs) in different cities in SA. The first study sampled a relatively small number of SME owners and conducted interviews following the COVID-19 pandemic. The second study interviewed owners and managers who experienced loadshedding within the food industry. Both studies found that power outages introduce significant interruptions to the operations of SMEs in terms of declining productivity. Power back-ups or generators can be used in the event of loadshedding, but these adaptations generate high operational costs which reduce profits. SMEs are a crucial factor in stimulating the economy and reducing poverty (Mwakajila 2021). These findings suggest that it is in the best interest of governments and policymakers to devise a plan to meet the growing demand for electricity. These studies also emphasise the importance of bringing new and different power sources online to diversify generation. Musabayana (2022) suggested the use of government loans to help SMEs purchase alternative power sources contributes to an environment that supports the growth and sustainability of small firms.
A large portion of my research to calculate the cost of loadshedding on the South African economy relates to the approach by Walsh et al. (2020) in Nova Economics. They observed that during periods loadshedding occurred, GDP growth declined. Their study used a CLRM to estimate the change in GDP growth over the period 2007 to 2019 and approximated that the total cost of loadshedding on the economy equated to R34.5 billion (approximately $1.9 billion). The authors noted that if the total amount of electricity shed had occurred in a single quarter in 2019, it would have reduced real GDP growth by 5 percent.
Reviewing previous literature, it is evident that the true costs of loadshedding, on a macroeconomic level, are difficult to quantify. While several studies have attempted to measure these impacts using both macro-and-microeconomic approaches, inconsistent data and short-time periods have made it difficult to accurately estimate economic loss. My research builds on existing models but applies an alternative approach to estimating the magnitude of loadshedding by calculating the difference between forecasted electricity demand and actual generation.
III. Conceptual Framework
Loadshedding occurs when the amount of electricity generated by Eskom is less than the amount of electricity demanded by consumers, resulting in a shortage. To prevent permanent damage to the power grid, Eskom will implement scheduled power outages until the grid stabilises. During periods of loadshedding, business operations are disrupted, imposing direct and indirect costs on firms and consumers. While the negative impacts on consumers are relevant, the remainder of this section focuses on the firm-level and macroeconomic impacts of loadshedding (see Figure 1).
Figure 1: Firm and macroeconomic impacts of loadshedding
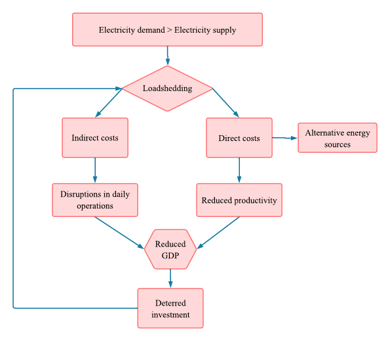
As illustrated in Figure 1, an energy shortage prompts the occurrence of loadshedding and introduces additional direct and indirect costs to the firm. Direct costs can occur when machinery that is dependent on electricity cannot be operated, limiting a firm’s productivity. However, indirect costs include losses outside of the workplace. One example occurs when non-working lights increase time spent in traffic and introduce delays to employees or transport of inputs and outputs. The magnitude of associated financial losses varies across industries, depending on their usage level and overall reliance on a stable electrical supply. However, the cumulative effect represents a decline in economic activity and therefore a reduction in GDP. In response, some firms (and households) have turned to alternative energy sources (generators and solar panels) to help mitigate the effects of loadshedding. These solutions are often expensive and not sustainable for long periods of time. The long-term effects accumulate if loadshedding persists; reduced investment further increases the likelihood of recurrences in the future.
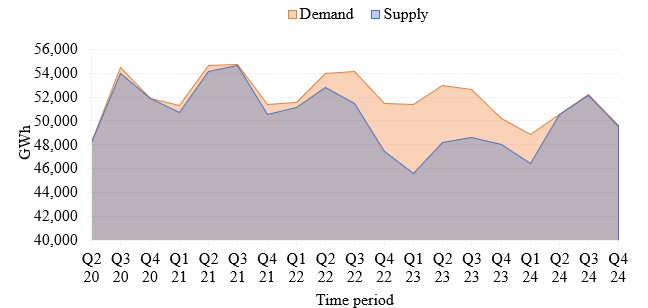
To better understand the severity of the demand deficit, hourly data from April 1, 2020, to December 31, 2024, were retrieved using the Data Request Form from Eskom’s System Operator. Figure 2 visualises this deficit: the difference in area between the supply side (shaded in blue) and the demand side (shaded in orange) represents the amount of electricity lost.
Figure 2: Electricity deficit
Source: Eskom’s Data Portal
During the earlier periods displayed in Figure 2, demand and supply were closely aligned with only a few minor gaps. However, that gap begins to widen after Q1 in 2022, and Q1 and Q4 in 2023 when the largest prolonged supply deficit occurs. The magnitude of that shortfall is calculated in the next section.
IV. Data and Methods
Within the Data and Methods section, subsections A and B describe how the magnitude of loadshedding is calculated using data from Eskom’s data portal, including its conversion into a variable that better captures the variation in GDP. Subsection C examines electricity that was generated by Eskom and exported to neighbouring countries during periods when loadshedding was implemented in SA. Subsection D outlines the inclusion of the loadshedding variable in regression analysis.
A. Estimating the Magnitude of Loadshedding
Data collected from Eskom’s System Operator was used to calculate the magnitude of loadshedding. The report included entries on Eskom’s demand and supply sides, renewable energy sources (wind, photovoltaic, concentrated solar power etc.), and outage performances (planned-, unplanned-, and other-capability loss factors). To focus on loadshedding specifically, only entries from the demand and supply sides were used. In Nova Economics, Walsh et al. (2020) emphasised that while the record is detailed and the frequency of loadshedding can be observed, it is not possible to directly quantify how much electricity would have been consumed if no outages had occurred. Therefore, the magnitude of loadshedding can only be estimated.
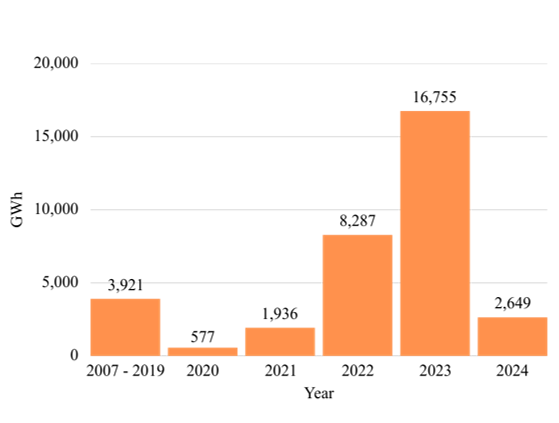
The electricity shortage is computed by calculating the difference between dispatchable generation and residual demand. Residual demand is defined within Eskom’s glossary as “the hourly average demand that needs to be supplied by all resources that can be dispatched by Eskom National Control. It includes Eskom generation, international imports, dispatchable IPPs and IOS. Normally expressed in MW” (Eskom Data Portal). Residual demand represents the gap in electricity supply that Eskom must fill to meet demand. On the supply side, Eskom does not formally define dispatchable generation, but provides a definition for available dispatchable capacity as “the capacity that is available from all dispatchable generation resources, and includes non-commercial generation, as it is dispatchable energy available to support the system” (Eskom Data Portal). The sum of all renewable and non-renewable power generation sources results in a value approximately equal to dispatchable generation. This suggests that dispatchable generation refers to the electricity supply from power sources Eskom can control to meet demand. Figure 3 shows the magnitude of loadshedding calculated between 2020 and 2024 using this alternative method. The inclusion of the cumulative (2007 to 2019) magnitude of loadshedding calculated by Walsh et al. (2020) within Figure 3 reveals the increased severity of loadshedding after 2019.
Figure 3: Magnitude of loadshedding in GWh, 2007-2024
Source: Eskom’s Data Portal
Based on data provided by Eskom’s system operator, Figure 3 shows the estimated total amount shed from April 2020 to December 2024 as 30,204 GWh. This value is nearly eight times greater than the total amount of electricity shed (3,921 GWh) from 2007-2019. A previous study estimated the cumulative amount of electricity shed was 1,775 GWh in 2021 and 8,116 GWh in 2022 (Erero 2023). My 2021 and 2022 estimates are commensurate with the estimates from this study.
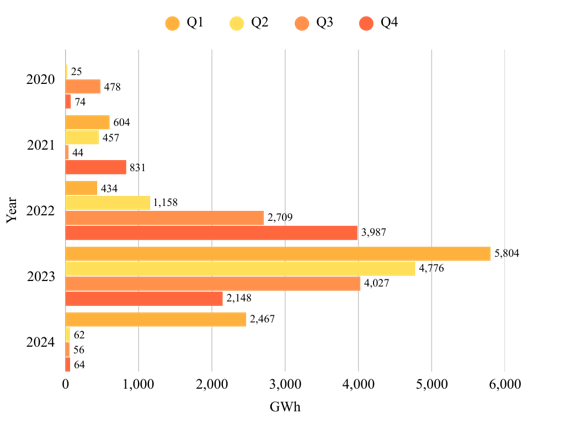
Each year since 2019 has seen loadshedding increase, with 2023 representing the highest level on record. More than double was shed compared to 2022 and nearly nine times more was shed than in 2021. According to SARB, without the disruptions caused by power outages, the country’s economy could have potentially grown by 2.3 percent instead of the actual 0.3 percent growth recorded in 2023 (Creamer 2023). The total amount of electricity shed in the first three months of 2024 exceeded the entire year’s total in 2021 by 713 GWh. This represents a far larger percentage of the year’s electricity shed in a fraction of the time. Figure 4 shows the quarterly breakdown of the loadshedding magnitude between 2020 and 2024.
Figure 4: Magnitude of loadshedding, quarterly in GWh
Source: Eskom’s Data Portal
The amount shed increased dramatically in the third quarter of 2022 and continued rising in 2023. In fact, more electricity was shed in the first quarter of 2023 (5,803 GWh) than in the entire period from 2007 to the end of 2020 (4,498 GWh). This surge in loadshedding can be attributed to several factors, notably the poor performance of aging power plants and an unanticipated heat wave which added further strain. Figure 5 displays the four crucial power stations (Matimba, Majuba, Medupi, and Kusile) that experienced reduced output (Rondganger 2023).
Figure 5: Location of Matimba, Majuba, Medupi, and Kusile coal-power stations
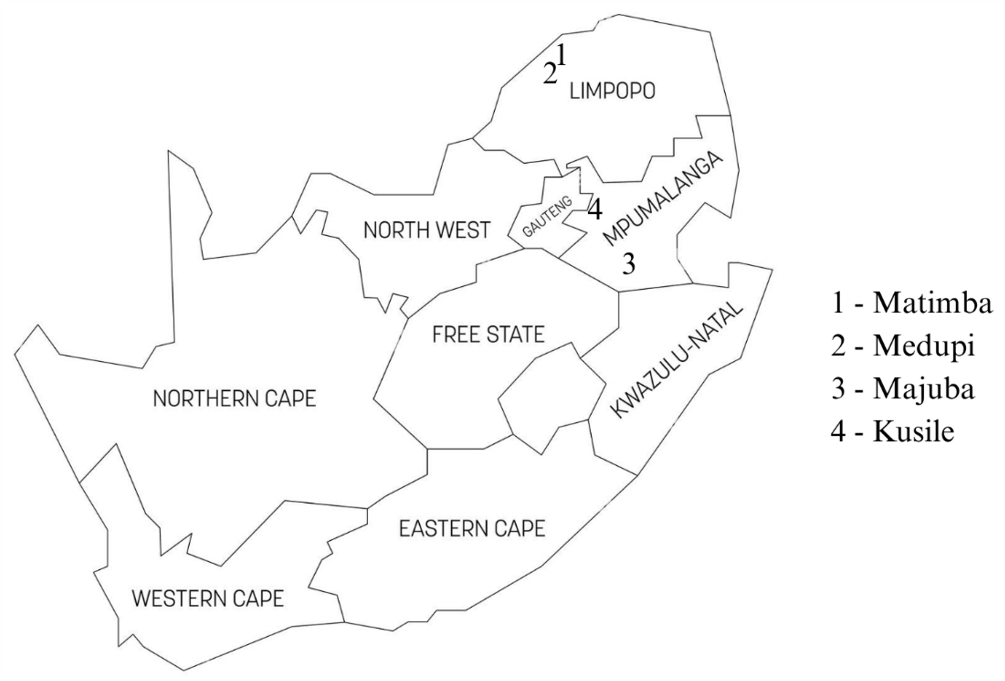
These outages deferred maintenance at Kusile, affecting three units and delaying the return to service of the nuclear power station, Koeberg Unit 1 (Daniels 2023). Kusile and Medupi are among the world’s largest coal-fired power plants, each with an installed capacity of 4,800MW (Eskom). Ultimately their delayed maintenance amidst high demand and constrained resources have contributed to the unprecedented surge in loadshedding. Although Figure 5 only delineates four out of the fourteen operational coal-power stations located across the northeast region, these four stations are among the largest in the country and represent stations required to take on an increased electricity load due to the concentration of generation capacity in this area.
While loadshedding was officially implemented only during the first three months of 2024, Figure 4 shows that electricity continued to be shed during quarters two, three, and four. The shedding in these periods could be due to unscheduled power outages and load reductions. Unscheduled power outages caused by failures in the grid tend to be infrequent, but still contribute to electricity loss. Load reductions which are normally smaller-scale or localised outages are used to stablise the grid without following the formal loadshedding schedule. While both events are less severe, they likewise contribute to the total GWh shed within the year.
B. Calculating Loadshedding as a Percentage of Electricity Sales
As mentioned previously, the power shortage is calculated by taking the difference between dispatchable generation and residual demand. Electricity sales represent the total amount of electricity consumed by end-users which, in this case, can be regarded as the residual demand. When loadshedding was expressed as a percentage of total electricity sales, it had more explanatory power (Walsh et al. 2020, 21). Therefore, to express loadshedding as a percentage of total electricity sales, the magnitude of loadshedding is divided by the sum of residual demand and the magnitude of loadshedding. Lastly, this value is multiplied by 100. Figure 6 shows the quarterly values expressed as a percentage of total sales.
Figure 6: Loadshedding as a percentage of sales, quarterly
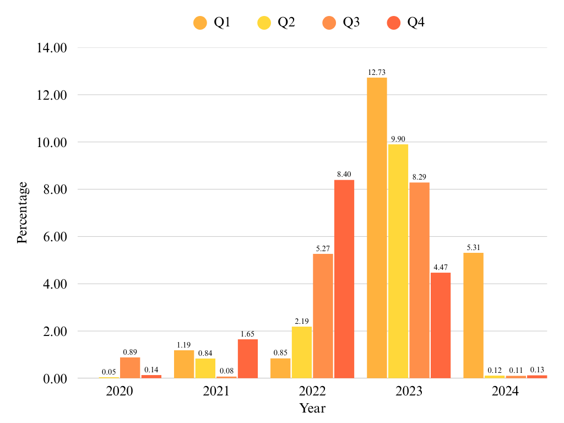
Source: Eskom’s Data Portal
Aside from 2022, 2023, and Q1 2024, loadshedding made up a relatively small amount of electricity sales, with its impact never surpassing 2 percent of the total electricity consumed. However, as shown in Figures 3 and 4, loadshedding intensified in the latter part of 2022 and remained common practice into 2024 Q1. During these periods, there was a large gap between the electricity demanded by consumers and the amount supplied due to loadshedding. In the four quarters of 2023, Eskom was able to meet an average of 91.15 percent of total electricity demand during loadshedding. This is comparable to 2020 and 2021, when Eskom was able to meet, on average, 98.35 percent of total electricity demand.
C. Determining Electricity Exported During Loadshedding
Eskom is contracted to supply energy to South African customers and the Southern African Development Community (SADC) region (Eskom). Of the sixteen state members comprising the SADC, SA only exports to seven countries (Botswana, Zimbabwe, Eswatini, Namibia, Zambia, Lesotho and Mozambique). During the fourth and most severe period of loadshedding, Eskom was still contracted to export electricity to its neighbouring countries. Figure 7 shows the amount of electricity that was exported only when SA’s own customers were experiencing loadshedding.
Figure 7: Electricity exported compared to loadshedding in GWh
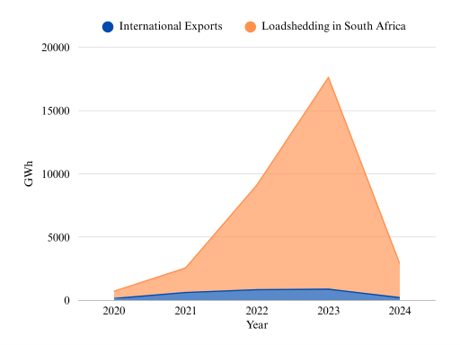
Source: Eskom’s Data Portal
This may appear insignificant when compared to the surge of electricity shed during 2022 and 2023. However, over a fourth of the electricity shed in 2020 and more than a third of that shed in 2021 was exported. Eskom maintained reliable supply to regional countries but not to its domestic consumers over this time period.
D. Applying a Linear Regression Model in the Context of Loadshedding
Equation 1 presents the linear regression model used to calculate the magnitude of loadshedding, where quarterly GDP growth (GDPi) is expressed as a function of household consumption (Ci), government expenditures (Gi), gross fixed capital formation (Ii), magnitude of loadshedding (LSi) and dummy variables (RECESSIONi , COVIDi).
Equation 1: GDPi = β0 + β1Ci + β2Gi + β3Ii + β4LSi + β5RECESSIONi + β6COVIDi + εi
In addition to coefficient β0 and the error term (εi) in Equation 1, Table 2 defines the variables used in the regression model and the sources of these data.
Table 2: Variables and measurement
| Variable | Definition (measurement) | Source |
|---|---|---|
| GDPi | Quarterly percentage change in gross domestic product including residual | SARB |
| Ci | Quarterly percentage change in final consumption expenditures by households | SARB |
| Gi | Quarterly percentage change in final consumption expenditures by general government | SARB |
| Ii | Quarterly percentage change in gross fixed capital formation
|
SARB |
| LSi | Magnitude of loadshedding as a percentage of total electricity sales in GWh
|
Eskom’s data portal. See section 5.B, Figure 6 |
| RECESSIONi | Dummy variable for 2019/20 economic recession.
(1 = recession, 0 = no recession) |
Recession in 4Q19, 1Q20, 2Q20 |
| COVIDi | Dummy variable for restrictions during the COVID-19 pandemic.
(1 = restrictions, 0 = no restrictions) |
COVID-19 lockdown restrictions 1Q20-2Q22 |
Data was collected from SARB website and are in constant 2015 Rand values, seasonally adjusted at annual rates (Maumela). https://www.resbank.co.za/en/home/what-we-do/statistics/releases/economic-and-financial-data-for-south-africa
Once the data from Table 2 are included in the regression model, it is expected that consumption, government, and gross fixed capital formation will have positive coefficients, as these variables are components of GDP and increase the total value of goods and services produced within a country’s borders.
On the other hand, loadshedding and the two dummy variables (2019/20 recession and COVID-19 pandemic) are expected to yield negative coefficients. It was theorised that loadshedding tends to disrupt productivity and output, which could reduce overall economic activity. The COVID-19 pandemic caused significant interruptions to both firms and consumers, while a recession reflects a general decline in economic activity. Therefore, these factors are expected to display a negative relationship with GDP growth.
V. Results
This section presents the empirical results of the regression analysis used to estimate the economic impact of loadshedding. The results are based on two regression models: one using quarterly values and the other using interpolated monthly values. The estimated coefficient of the loadshedding variable in the second regression model is then converted into a monetary value for estimating the economic loss associated with loadshedding. The section concludes by acknowledging potential shortcomings of this research.
A. Regression Analyses
Table 3 displays the values for the coefficients of the initial regression.
Table 3: Regression 1
| Variable | Coefficient | t-Statistic | Prob. |
|---|---|---|---|
| Consumption | 0.085 | 0.718 | 0.488 |
| Government | 0.074 | 0.196 | 0.848 |
| Gross Fixed Capital Formation | 0.387 | 2.891** | 0.015 |
| Loadshedding | -0.095 | -0.986 | 0.345 |
| COVID Dummy | 0.460 | 0.607 | 0.556 |
| Recession Dummy | -4.662 | -2.084* | 0.061 |
| R-Squared | 0.951 | ||
| Adjusted R-Squared | 0.924 | ||
| F-Statistic | 35.324 | ||
Note: Statically significant variables are shown in bold. *p<0.1, **p < 0.05, ***p<0.01
Gross fixed capital formation has the expected positive sign and shows the strongest correlation with GDP growth. The loadshedding variable and the recession dummy variable possess the expected negative sign, indicating a negative correlation with quarterly GDP growth. The consumption and government expenditure components have the expected positive sign, denoting a positive correlation with GDP. Although the F-statistic conveys that the regression is significant, the t-statistics reveal that only gross fixed capital formation is significant at the 0.05 level while the recession dummy variable is significant at the 0.10 level, holding all other variables constant. Although there is prior evidence that loadshedding causes economic malaise (van Niekerk 2025), the loadshedding variable does not exhibit statistical significance within the initial regression. This result suggests that loadshedding had no impact on GDP growth.
Given that data acquired from Eskom used to calculate the loadshedding variable are observed quarterly (April 2020 to December 2024), the initial regression model relied on 18 observations. In standard regression analysis, a sample size below 30 observations is considered small and may lead to low statistical power. However, since the raw data were expressed in hourly values, they could be converted to monthly values. To ensure consistency across variables, GDP, consumption, gross fixed capital formation, and government spending were also converted into monthly values using Linear Interpolation.
Linear Interpolation assumes that there is a linear change between quarterly values when generating monthly values. Equation 2 shows the interpolated monthly values, for a variable Y, between quarter t and t+1:
Equation 2: $$Y_{t,m}=Y_t+ \frac{m}{3} (Y_{t+1}- Y_t ),m=1,2$$
where m represents the number of months between the two quarterly values.
This method added 37 additional observations improving the degrees of freedom and statistical power of the regression. Table 4 displays the associated regression results based on monthly interpolated data.
Table 4: Regression 2
| Variable | Coefficient | t-Statistic | Prob. |
|---|---|---|---|
| Consumption | 0.133 | 2.237** | 0.030 |
| Government | -0.051 | -0.272 | 0.787 |
| Gross Fixed Capital Formation | 0.434 | 7.096*** | 0.000 |
| Loadshedding | -0.018 | -1.578 | 0.121 |
| COVID Dummy | -0.745 | -3.726*** | 0.001 |
| Recession Dummy | 0.299 | 2.669*** | 0.010 |
| R-Squared | 0.920 | ||
| Adjusted R-Squared | 0.910 | ||
| F-statistic | 91.794 | ||
Note: Statically significant variables are shown in bold. *p<0.1, **p < 0.05, ***p<0.01
The regression results indicate strong statistical significance for most variables, except for government expenditures. Consumption and investment exhibit positive coefficients, aligning with expectations, and are statistically significant at the 0.05 and 0.01 levels, respectively. Both the loadshedding and COVID-19 dummy variables have negative coefficients which indicate a negative correlation with GDP growth. The loadshedding coefficient can be interpreted as a 1 percent increase in loadshedding (relative to total electricity sales) reduces GDP growth by 0.018 percent, holding all other variables constant. This result is marginally statistically significant at the 10 percent level. Although this impact may be small in magnitude, loadshedding was persistent over the relatively short time period. If loadshedding continues in the long run, a sustained 1 percent increase in loadshedding over a 12-month period could imply an aggregated 0.216 percent (0.018 x 12) reduction in annual GDP growth, assuming the effect is linear. For a country like South Africa, where growth rates are already relatively low, continued reductions will have negative implications on employment, investment and exports (Ndubuisi et al. 2026).
The recession dummy variable shows an unexpected positive coefficient, and is significant at the 0.01 level. A potential explanation for this result is the short duration of the recession within the sampled period. SA experienced a relatively short recession between Q3 2019 and Q2 2020, while the study extends to the end of 2024. Conditional on other negative shocks (COVID-19 pandemic and loadshedding), the recession dummy variable is likely capturing the recovery of the economy rather than the downturn.
B. Monetary Value of the Loss on the Economy
A multi-step approach is used to quantify the economic impact of loadshedding to the SA economy. First, the percentage reduction in GDP growth is estimated using the regression coefficient for loadshedding (-0.018) and multiplying it by each month’s loadshedding percentage of total sales (see Equation 3). Thus, the percentage loss in GDP growth for each month is calculated as follows:
Equation 3: $$\% \text{GDP loss}= -0.018 × \% \text{ loadshedding of total electricity sales}$$
Next, the absolute reduction in GDP is determined by applying this percentage loss to the GDP value for each month as described in Equation 4:
Equation 4: $$\text{Total GDP loss}=\frac{\% \text{ GDP loss}}{100} × \text{Monthly GDP values}$$
Finally, the Cost of Load Shedding (CoLS) is computed by dividing the total GDP loss by the magnitude of electricity shed according to Equation 5:
Equation 5: $$CoLS=\frac{\text{Total GDP loss (R)}}{\text{Magnitude of loadshedding (kWh)}}$$
This value is then adjusted for inflation using CPI data from StatsSA. The results indicate that each kilowatt-hour (kWh) lost due to loadshedding costs the economy R8.43 in 2024 prices. When this cost is multiplied by the cumulative electricity shed, the total economic loss due to loadshedding is estimated at R254 billion (approximately $13.9 billion). Therefore, the cumulative impact of loadshedding from April 2020 to December 2024 resulted in a nearly 6 percent reduction in GDP growth in SA.
C. Potential Shortcomings
Within the CLRM analyses, a negative relationship between GDP and loadshedding was anticipated. However, this relationship may have been disrupted by the economic effects from the COVID-19 pandemic. Since the relationship between loadshedding and quarterly GDP growth may not be strictly linear, an alternative model could be used that may capture a more complex relationship related to loadshedding. The current model does not account for the difficult-to-measure, long-term costs of loadshedding, potentially resulting in an underestimation of the full cost of this practice.
Using GDP as the dependent variable can lead to multicollinearity and potential endogeneity. Multicollinearity issues occur when the independent variables are correlated with each other. This makes it difficult to completely isolate the true effects each variable has on the outcome variable (Studenmund 2015). Since consumption, investment and government spending are direct components of GDP (suggesting variables are likely interrelated) and GDP is included simultaneously in the regression, this might inflate the standard errors and reduce the significant impact the independent variables have on GDP growth. This specification also raises concerns about endogeneity. As mentioned, because GDP is constructed of these components, there may be a bilateral relationship. This means that changes in GDP may influence its components, while those same components are used to explain GDP. These issues make it difficult to establish a clear causal relationship between the independent variables and GDP growth.
Data availability represents the main limitation of this research since Eskom provided only five years of observations for conducting this analysis. Quarterly data resulted in only 18 data points between Q2 2020 and Q4 2024, which made it more challenging to accurately measure the impact of loadshedding on GDP growth. Converting the quarterly data into monthly values via linear interpolation added 37 more data points for observation. However, this approach could introduce issues with data consistency and comparability.
VI. Conclusion
South Africans have been experiencing scheduled power outages, known as loadshedding, since 2007. These persistent outages stem from Eskom’s actions (exporting electricity to other countries during periods of loadshedding in SA) and inactions (insufficient investment and maintenance of infrastructure), which have both hindered its ability to meet the country’s growing demand for electricity. Since 2020, both the frequency and severity of these outages have escalated significantly.
Previous studies have shown that loadshedding is a global issue, with various methods quantifying its economic impact (macroeconomic and sector-based analyses) over shorter timeframes. This paper detects negative correlation between loadshedding and GDP, and uses the linear regression coefficient associated with loadshedding to estimate that economic impact of loadshedding. Using data from Eskom’s data portal, an estimated 30,204 GWh of electricity was shed between April 2020 and December 2024. These disruptions have caused major challenges for individuals and firms, with substantial economic costs, and with a significant number of customers turning to alternative energy sources.
Two regression models, one using quarterly values and another with interpolated monthly values, comprise the analysis. The loadshedding coefficient from the second regression (based on interpolated monthly values) was used to estimate the monetary value of loadshedding. Over five years, loadshedding has resulted in an economic loss of R254 billion (approximately $13.9 billion), representing nearly a 6 percent reduction in GDP growth. The results of these analyses highlight that loadshedding is not only a current issue, but one that can introduce even greater long-term costs to the SA economy if an immediate and permanent solution is not implemented.
VII. References
Abbas, Malaika. 2016. “The Direct and Indirect Costs of Power Outages to Small Scale Manufacturing Industries of Punjab.” https://mpra.ub.uni-muenchen.de/83189/1/MPRA_paper_81264.pdf
Allos, Maan. 2023. “Load-Shedding & Blackouts in South Africa.” Sollatek. April 12, 2023. https://www.sollatek.com/load-shedding-black-outs-are-on-the-rise-in-south-africa/
Bourdin, Julie. 2024. “South Africa’s Energy Crisis Is Driving a ‘Solar Boom’, but There’s a Downside.” African Arguments. March 28, 2024. https://africanarguments.org/2024/03/south-africa-electricity-crisis-is-driving-a-solar-boom-but-there-is-a-downside/
Creamer, Terence. 2023. “Graphics Confirm 2023 as Loadshedding’s Annus Horribilis.” Engineering News. November 27, 2023. https://www.engineeringnews.co.za/article/graphics-confirm-2023-as-loadsheddings-annus-horribilis-2023-11-27
Daniels, Nicola. 2023. “2023 Cumulative Load Shedding Worst in 15 Years.” Independent Online. IOL. December 28, 2023. https://www.iol.co.za/capetimes/news/2023-cumulative-load-shedding-worst-in-15-years-3994e911-8df7-4968-a201-b0e3f6e1792d
Department of Minerals and Energy (DME). 1998. “White Paper on the Energy Policy of the Republic of South Africa.” https://www.gov.za/sites/default/files/gcis_document/201409/whitepaperenergypolicy19980.pdf
Erero, Jean L. 2023. “Impact of Loadshedding in South Africa: A CGE Analysis.” Journal of Economics and Political Economy. https://journals.econsciences.com/index.php/JEPE/article/view/2448
Eskom. “Coal Fired Power Stations.” 2021. https://www.eskom.co.za/eskom-divisions/gx/coal-fired-power-stations/
Eskom. “Company Information.” 2024. https://www.eskom.co.za/about-eskom/company-information/
Eskom. “Finding and Interpreting Schedules” n.d. https://loadshedding.eskom.co.za/loadshedding/ScheduleInterpretation
EskomSePush. “ESP – the Best Loadshedding App.” n.d. https://esp.info/
Eskom Data Portal. “Glossary of Terms.” n.d. https://www.eskom.co.za/dataportal/glossary/
Kessides, Ioannis. 2020. “The Decline and Fall of Eskom; a South African Tragedy.” The Global Warming Policy Foundation. https://www.thegwpf.org/content/uploads/2020/06/Decline-Fall-Eskom.pdf
Mago, Stephen, and Olayide Olajuyin. 2022. “Effects of Load-Shedding on the Performance of Small, Medium and Micro Enterprises in Gqeberha, South Africa.” Management and Economics Research Journal 8 (4): 1–8. https://doi.org/10.18639/merj.2022.1716925
Maumela, Patrick. n.d. “Economic and Financial Statistics for South Africa.” South African Reserve Bank. https://www.resbank.co.za/en/home/what-we-do/statistics/releases/economic-and-financial-data-for-south-africa
Menati, Ali, and Le Xie. 2021. “A Preliminary Study on the Role of Energy Storage and Load Rationing in Mitigating the Impact of the 2021 Texas Power Outage.” 2021 North American Power Symposium (NAPS), November. https://doi.org/10.1109/naps52732.2021.9654452
Moolman, Sean. 2021. “2022 Update: Eskom Tariff Increases vs Inflation since 1988 (with Projections to 2043).” Power Optimal. August 1, 2021. https://poweroptimal.com/2021-update-eskom-tariff-increases-vs-inflation-since-1988/
Mwakajila, Happy, and Riziki Nyello. 2021. “Leadership Styles, Firm Characteristics and Business Financial Performance of Small and Medium Enterprises (SMEs) in Tanzania.” Open Journal of Business and Management 09 (04): 1696–1713. https://doi.org/10.4236/ojbm.2021.94093
Ndubuisi, Gideon, Elvis Avenyo. “Jobs, investments, and exporting: The real effects of electricity crisis in South Africa.” Energy Economics, vol. 157, May 2026, p. 109234, https://doi.org/10.1016/j.eneco.2026.109234
Nkosinathi Ndlovu. 2024. “South Africa Is Not Alone: The Other Countries with Load Shedding.” TechCentral. November 25, 2024. https://techcentral.co.za/countries-with-load-shedding-south-africa/255831
Oluwatimilehin Aiku. 2025. “Eskom Commissions Kusile Unit 6, Adds 800 MW Coal Power.” The Electricity Hub. October 2, 2025. https://theelectricityhub.com/eskom-commissions-800-mw-coal-fired-unit-at-kusile-power-plant/
Otter, Alastair. 2024. “Loadshed.” The Outlier. September 22, 2024. https://theoutlier.co.za
Oxford English Dictionary “Load-Shedding.” 1976. https://www.oed.com/dictionary/load-shedding_n?tl=true
Pasha, Hafiz, and Wasim Saleem. 2013. “The Impact and Cost of Power Load Shedding to Domestic Consumers.” The Pakistan Development Review 52 (4I): 355–73. https://doi.org/10.30541/v52i4ipp.355-373
Reuters. 2023. “South Africa Amends Eskom Debt Relief, Making Loans Interest-Bearing.” Reuters, November 1, 2023. https://www.reuters.com/world/africa/south-africa-amends-eskom-debt-relief-making-loans-interest-bearing-2023-11-01/
Rondganger, Lee. 2023. “The Year We Were Plunged into Darkness: A Record 332 Days of Load Shedding in 2023 and Counting.” Independent Online. IOL. December 11, 2023. https://www.iol.co.za/news/south-africa/the-year-we-were-plunged-into-darkness-a-record-332-days-of-load-shedding-in-2023-and-counting-63eafd30-87c8-4f13-acd0-60071e509239
StatsSA. “CPI Headline.” 2025. www.statssa.gov.za/publications/P0141/CPIHistory.pdf
South African Reserve Bank. “Selected Historical Rates – Rand per US Dollar.” 2024. https://www.resbank.co.za/en/home/what-we-do/statistics/key-statistics/selected-historical-rates
South African Revenue Service. “Solar Tax Rebate” 2024. https://www.sars.gov.za/types-of-tax/personal-income-tax/filing-season/solar-tax-rebate/
Studenmund, A H. 2015. Using Econometrics : A Practical Guide. 7th ed. Harlow, Essex: Pearson Education Limited.
Tambudzayi Musabayana. 2024. “The Effects of Electricity Load-Shedding on the Performance of Small and Medium Enterprises in Pretoria, South Africa: A Case Study of Marabastad Business Community.” Journal of Energy in Southern Africa 34 (1): 1–15. https://doi.org/10.17159/2413-3051/2023/v34i1a16768
Timilsina, Govinda, Prakash Sapkota, and Jevgenijs Steinbuks. 2018. “How Much Has Nepal Lost in the Last Decade due to Load Shedding? An Economic Assessment Using a CGE Model.” Open Knowledge Repository. World Bank Group. https://doi.org/10.1596/1813-9450-8468
United Nations Economic Commission for Africa (UN ECA). 2021. “Governance of State-Owned Enterprises in South Africa: Enhancing Performance, Efficiency and Service Delivery.”.https://www.yunbaogao.cn/index/partFile/5/uneca/2023-02/5_32100.pdf
Van Niekerk, Albertus. 2025. “Out of the Darkness: The Lasting Economic Costs of Load-Shedding” FTI Consulting. October 25, 2025. https://www.fticonsulting.com/insights/articles/out-darkness-lasting-economic-costs-load-shedding
Walsh, Kay, Rachel Theron, Ahmed Seedat, and Chris Reeders. 2020. “Estimating the Economic Cost of Load Shedding in South Africa.” Nova Economics. https://www.novaeconomics.co.za/our-work/estimating-the-economic-cost-of-load-shedding-in-south-africa
Western Cape Government. 2019. “Load Shedding Fact Sheet.” https://www.wesgro.co.za/uploads/files/Research/Load-Shedding-FAQ-2019.pdf
World Bank Group. 2018. “Access to Energy Is at the Heart of Development.” April 18, 2018. https://www.worldbank.org/en/news/feature/2018/04/18/access-energy-sustainable-development-goal-7
Wu, Dongqi, Xiangtian Zheng, Ali Menati, Lane Smith, Bainan Xia, Yixing Xu, Chanan Singh, and Le Xie. 2022. “How Much Demand Flexibility Could Have Spared Texas from the 2021 Outage?” Advances in Applied Energy 7 (August). https://doi.org/10.1016/j.adapen.2022.100106
VIII. Acknowledgements
I would like to thank my professors, Dr. Tonya Hansen and Dr. Oscar Flores-Ibarra, for their continued support and guidance throughout my research. I also want to extend my gratitude to the engineers, David Oberholzer and Keagan Carlisle, for their help in interpreting the data obtained from Eskom.
Appendices
Appendix A
Table A: Periods of loadshedding prior to 2020
| Period | Total GWh shed | Months affected |
|---|---|---|
| October 2007 – April 2008 | 872 | 7 of 7 months |
| November 2013 – October 2015 | 1,742 | 16 of 24 months |
| June 2018 – December 2019 | 1,307 | 9 of 19 months |
Caption: This table shows the three periods of loadshedding that occurred between 2007 and 2020 identified by Walsh et al. 2020.