Volume 35: Paper 5
Vegetation and Food Security in Nigeria: Evidence from Six Regional Zones
Ananya Kohli
Mount Holyoke College
“Food security, as defined by the World Food Summit in 1996, means that all people, at all times, have access to sufficient, safe, and nutritious food that meets their dietary needs and food preferences for an active and healthy life” (Food and Agriculture Organization 1996). Climate change has heavily disrupted food chains by causing extreme weather events, such as cyclones and heat waves, to occur more frequently. Nigeria remains one of the most affected countries, with a projected 33 million people expected to live in food scarcity, particularly in the northeastern regions of Borno, Adamawa, and Yobe (UN 2024). With the increased occurrence of extreme weather events, the uncertainty in agriculture in Nigeria has grown (Akpa 2021). In Malawi, a study conducted by Johnson and Brown (2010) integrated the Normalized Difference Vegetation Index (NDVI) with Demographic and Health Survey (DHS) data. They found that NDVI levels during the growing season had been strong predictors of child malnutrition. When the NDVI was low, indicative of a drought-like condition, rates of stunting and wasting among children were significantly higher, and child survival rates were lower. These findings have not been corroborated in Nigeria, and their relationship with food security remains unclear.
Nigeria has six main geopolitical zones (Figure 1), namely South East, South South, South West, North Central, North West, and North East. The six geopolitical zones of Nigeria each have extremely diverse climates (World Bank Group 2021). The south of Nigeria is influenced by the Gulf of Guinea and has a tropical monsoon climate. The north central region is characterized by a savanna climate and has distinct seasons. The North has a semi-arid climate. The North Eastern region of Nigeria has been affected by conflict since 2009, attributable to the Boko Haram group (Bertoni et al. 2019). This conflict has also significantly impacted the food chain disruptions in the region.
Figure 1: Map of Nigeria showing all six geopolitical zones
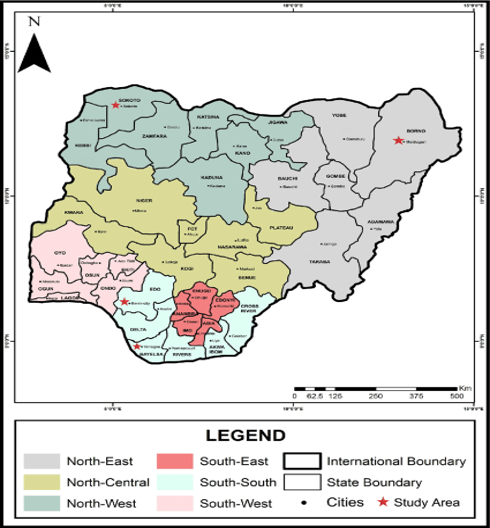
Note: Sourced from (John Asekhaen Ohiolei et al. 2019)
Past research has focused on the impact of vegetation on only one region. This paper aims to fill the gap in spatial analysis done across the six regions regarding the impact of vegetation density. By obtaining a clear picture of how vegetation density affects the food security of all six regions, it is easy to analyze impacts on the whole food ecosystem. We can also compare which regions suffer from poor food security and aim to create policies that can create strong local supply chains. We also use NDVI, as it is a good proxy measure of general crop health. Even though it measures total greenness or the lack of it, it is a good way to know the general health of crops in the area (Johnson and Brown 2010).
The primary research question is how vegetation density affects food security across all six regions of Nigeria, holding rainfall constant. By taking the average NDVI across the growing season, you can measure the real effects of agricultural vegetation health and reduce the noise that would be caused by static forest or bush cover.
I. Background
The main motivation for writing this paper is the increasing threats of areas becoming prone to food insecurity. Food insecurity not only negatively affects people’s health but also has been linked with poor school attendance and performance (Barnabas, Miroslava Bavorova, and Mustapha Yakubu Madaki 2024). Nigeria, being the most populous country in Africa, has an agricultural sector that constitutes around 21 percent of its GDP. Around 70 percent of rural dwellers are subsistence farmers (International Fund for Agricultural Development 2014). However, the country also faces long-standing food security challenges. According to the World Food Programme (2024), in 2025, Nigeria will have a staggering 33 million people who will face acute food insecurity, approximately 5.4 million of whom are children. The country will also have nearly 800,000 pregnant and breastfeeding women who are at risk of acute malnutrition. Despite the government’s best efforts to implement agricultural transformation programs, low agricultural productivity, unstable output, and uneven resource distribution across regions continue to hinder the achievement of food security goals.
Income distribution also plays a key role in Nigeria’s food dynamics. Taking a closer look at the income distribution in Nigeria (Appendix Figure 4), the regions in the north have lower income levels compared to the southern regions. The Northeastern regions also face the constant threat of war, which has significantly impacted their food security (Mukhtar 2020). The Southern region has access to key ports and relies heavily on fishing as well as agriculture for its primary sustenance (Mayah 2017).
Given these sharp regional differences, both in terms of income and other characteristics, conducting separate analyses for each of these regions makes methodological sense. It is also a better approach to develop sound regional policies. Therefore, this study uses six detailed regional zones and performs separate regression analyses for each.
II. Data and Empirical Strategy
This study uses data from the Living Standards Measurement Study – Integrated Surveys on Agriculture (LSMS-ISA) conducted between 2018-19 and updated in 2021. This survey provides detailed information on consumption patterns, household demographic characteristics, and other socio-economic indicators. The primary outcome of interest was food security, as measured by food purchased and food consumed per capita. Rainfall was held constant to examine the isolated relationship between NDVI and food security.
NDVI across the growing period was used, as it accurately captures crop health and vegetation density during food production. To examine the impact of the vegetation on food security across all six regions, two main regressions were constructed, and each of those regressions was estimated separately across all six zones. The primary outcomes of interest were constructed by adding all the food ownership and food purchase columns in the total consumption dataset from the LSMS-ISA surveys. To isolate the effect of NDVI, food security variables were regressed on rainfall alone. The residuals from that model explain the part of food security not explained by rainfall. Subsequently, rainfall-adjusted residuals were regressed on each zone separately.
This two-step method allows us to see the independent effect of vegetation on food security without the confounding relationship of rainfall. Running zone specific regressions further highlights the strength of NDVI relationships across the six zones of Nigeria. All this data has been collected at the household level across all six regions of Nigeria.
The regression models can more formally be represented as:
- To control the effects of rainfall:
(1) FOOD_OWNi z= α1 z+ β1 z RAINFALL i z + ϵ i z
(2) FOOD_PURCHASEDi z = α2 z + β2 z RAINFALL i z +ν i z
Where α1 z and α2 z are the intercepts, β1 z and β2 z are the effects of rainfall on food purchased and food grown respectively and, ϵ i z and ν i z are the residuals used in the next regressions.
These regressions are estimated separately for all six of Nigeria’s six regions.
- Effects of NDVI on food purchased:
(3) νi z = θz + ϕz NDVI i z +μi z
Where νi z is the residual from the first regression on food purchased (part of food security that is not explained by the rainfall), θz is the zone-specific intercept, ϕz is the zone specific NDVI effects and μi z is the error term.
- Effects of NDVI on food grown by own:
(4) ϵi z = γz + δz NDVI i z +σi z
Where ϵi z is the residual from the first regression on food grown (part of food security that is not explained by the rainfall), γz is the zone-specific intercept, δz is the zone specific NDVI effects and σi z is the error term.
III. Findings
The findings from these regressions can be classified into two categories, effects on food purchased and effects on food produced/grown.
Figure 2: Effect of NDVI on Rainfall-Adjusted Purchased Food (Separate Models by Zone)
Skip to main contentAccessibility help
AI Mode
All
Exact matches
Visual matches
This table displays the results of six separate statistical regression models. They evaluate how NDVI (Normalized Difference Vegetation Index) relates to an outcome across different regions (North Central, North East, North West, South East, South South, South West).
Model Estimates: NDVI significantly predicts the outcome in North Central and South South (p < 0.001) with negative coefficients, while North West and South West show positive, non-significant relationships.
Model Fit (R²): The R² values are extremely low across all models (ranging from 0.000 to 0.019), indicating that NDVI explains virtually zero variance in the dependent variable in most regions.
Errors & Observations: Each model runs on approximately 824–845 observations. The South South model has the highest Root Mean Square Error (RMSE), at 72,355.65.
| North Central | North East | North West | South East | South South | South West | |
|---|---|---|---|---|---|---|
| NDVI | -103 477.960*** (25 942.327) |
-60 150.054+ (31 248.920) |
12 916.510 (43 749.200) |
4969.175 (35 330.407) |
-132 826.486*** (36 401.749) |
7301.423 (17 416.446) |
| Num.Obs. | 845 | 825 | 843 | 824 | 815 | 824 |
| R2 | 0.019 | 0.004 | 0.000 | 0.000 | 0.016 | 0.000 |
| R2 Adj. | 0.017 | 0.003 | -0.001 | -0.001 | 0.015 | -0.001 |
| AIC | 20 377.6 | 19 704.6 | 20 038.7 | 20 747.5 | 20 557.5 | 20 160.8 |
| BIC | 20 391.8 | 19 718.7 | 20 052.9 | 20 761.6 | 20 571.6 | 20 175.0 |
| Log.Lik. | -10 185.812 | -9849.278 | -10 016.361 | -10 370.730 | -10 275.754 | -10 077.416 |
| F | 15.910 | 3.705 | 0.087 | 0.020 | 13.315 | 0.176 |
| RMSE | 41 575.95 | 37 033.58 | 34 991.70 | 70 749.38 | 72 355.65 | 49 559.80 |
+ p < 0.1, * p < 0.05, ** p < 0.01, *** p < 0.001
Note: This figure presents the results of zone-specific regressions of rainfall-adjusted purchased food on the Normalized Difference Vegetation Index (NDVI). The dependent variable is the residual from regressing purchased food on rainfall, capturing market food demand unrelated to rainfall shocks. Negative coefficients indicate that higher vegetation is associated with reduced reliance on purchased food, while positive coefficients indicate greater reliance on markets despite vegetation gains. Robust standard errors are reported in parentheses. * p<0.10, ** p<0.05, *** p<0.01.
North Central: In the North Central regions of Nigeria, an increase in NDVI is associated with a significant decrease (p is significant at the one percent level) in the amount of food purchased. This indicates that as vegetation density in an area increases, the amount of food purchased decreases.
North East: In the North East regions of Nigeria, an increase in NDVI is also associated with a decrease in the food purchased, but this effect is only moderately significant (p is significant at the one percent level). The increase in vegetation in these areas may lead to a slight decrease in purchased food, but the relationship between them is not strong.
North West, South East, and South West: In these three regions, the relationship between an increase in NDVI and the amount of food purchased is positive but extremely small and not statistically significant. Therefore, no meaningful relationship can be inferred from them.
South-South: In the South-South region of Nigeria, there is a significant negative association (p is significant at the one percent level) with an increase in NDVI. This means that the greener regions of the South rely heavily on producing their own food when the vegetation is good.
Figure 3: Effect of NDVI on Rainfall-Adjusted Own-Produced Food (Separate Models by Zone)
| North Central | North East | North West | South East | South South | South West | |
|---|---|---|---|---|---|---|
| NDVI | 54 385.953*** (11 020.873) |
3456.739 (11 920.149) |
57 930.530*** (12 723.545) |
39 469.284** (14 159.736) |
8675.633 (14 762.867) |
60 850.427*** (7949.681) |
| Num.Obs. | 845 | 825 | 843 | 824 | 815 | 824 |
| R2 | 0.028 | 0.000 | 0.024 | 0.009 | 0.000 | 0.067 |
| R2 Adj. | 0.027 | -0.001 | 0.023 | 0.008 | -0.001 | 0.065 |
| AIC | 18 930.8 | 18 114.4 | 17 956.5 | 19 240.6 | 19 086.4 | 18 868.3 |
| BIC | 18 945.1 | 18 128.5 | 17 970.7 | 19 254.8 | 19 100.5 | 18 882.5 |
| Log.Lik. | -9462.421 | -9054.180 | -8975.240 | -9617.313 | -9540.215 | -9431.167 |
| F | 24.352 | 0.084 | 20.730 | 7.770 | 0.345 | 58.591 |
| RMSE | 17 662.38 | 14 126.75 | 10 176.61 | 28 354.97 | 29 344.11 | 22 621.41 |
+ p < 0.1, * p < 0.05, ** p < 0.01, *** p < 0.001
Note: This figure presents the results of zone-specific regressions of rainfall-adjusted own-produced food on the Normalized Difference Vegetation Index (NDVI). The dependent variable is the residual from regressing own production on rainfall, representing subsistence production net of rainfall effects. Positive coefficients imply that improved vegetation is associated with higher household production, while negative coefficients suggest reduced reliance on own production as vegetation improves. Robust standard errors are reported in parentheses. * p<0.10, ** p<0.05, *** p<0.01.
North Central: Consistent with our observations above, an increase in the NDVI indicates a positive amount of food grown. The relationship is statistically significant (p is significant at the one percent level). This implies that as the vegetation index of an area increases, households rely more heavily on producing their food.
North East: In the North East, a positive but insignificant relationship is observed; this means that it is difficult to determine the relationship between an increasing NDVI and the amount of food grown.
North West: In the North West, a highly positive and significant relationship (p is significant at the one percent level) is observed between NDVI and the amount of food grown. This suggests that as the vegetation in an area becomes healthier and increases, the amount of food grown by households also increases.
South East: A similar pattern is observed in the South East, where a higher NDVI is related to a positive and significant (p is significant at the one percent level) increase in food grown.
South South: In the South South, like the North East, there is a positive but insignificant relationship between NDVI, and the food grown.
South West: In the South West, like the North West and North Central, there is a positive and highly significant (p is significant at the one percent level) relationship observed between NDVI, and the amount of food grown, indicating that a higher NDVI results in households relying more on subsistence farming.
These results are depicted graphically in the appendix (Figures 6 and 7).
IV. Discussion
NDVI plays a dual role in food security. Higher vegetation density is strongly correlated with an increase in production throughout most regions in Nigeria, except in the North East and the South South. The caveat here may be that in the South-South, the population may be heavily dependent on fishing, in addition to agriculture (FAO 2024). So, it may be true that while an area is getting greener, the population is not solely dependent on agriculture. In the North East, a possible explanation for NDVI not being a strong predictor for an increase in subsistence farming may be that due to ongoing conflict, this region is fraught with fragile agricultural systems and high levels of displacement.
The role of NDVI with food purchased is a little different. It has a significant negative relationship in the North Central and South-South and has a moderately negative relationship in the North East. For the rest of the regions, positive, albeit insignificant, results are observed. In other areas, it may be likely that due to greater market integration, the role of NDVI in changing purchasing patterns is insignificant. This is supported by the evidence that Nigerian food markets, especially in urban and southern areas, are better integrated, enabling households to access food from different markets when agricultural conditions are not stable in their area (Amare et al. 2023).
The point here is also to compare and see if food purchased and food grown are complements or substitutes for each other. From the data that I have collected, it is unclear what their relationship with each other is without adding more variables to the regression. However, an observation that could be made simply by taking effect on the North East is that a higher NDVI is indicative of a moderate increase in the food purchased but no effects on food grown. Due to the conflict in this region, it may be that the only way the population can have access to food is by purchasing it, as they cannot access their land. However, this is not a decisive statement, and additional variables like income, access to markets, and land ownership are important.
V. Conclusion
This study aimed to examine the impacts of vegetation health and density on food security, as measured by the amount spent on purchasing food and the estimated amount of food grown by households. After adjusting for rainfall, we found that a higher NDVI is strongly associated with increased food production in all regions except the North East and South South, due to their respective unique conditions and considerations. NDVI’s influence on food purchasing patterns was generally weak, due to the role market integration plays in smoothing over consumption shocks. These findings highlight how imperative the health of vegetation is regarding a household’s food security. The patterns of vegetation are being heavily disrupted by climate change and are becoming more erratic.
The wide variation in our results across zones also suggests that factors other than the ones in our model shape how environmental factors translate into food security. In regions where agriculture is the predominant occupation, policies should be formulated to train farmers on climate-resilient farming. Moreover, enhancing less integrated market infrastructure can help them to better resist agricultural shocks. Also, if farmers can increase their crop diversification, it can also help them to reduce their dependence on single crop types and increase the resilience of their food systems.
VI. Limitations and Future Studies
While this study has provided many valuable findings for the relationship between environmental factors and household food security across six regional zones in Nigeria, there are still some limitations. First, the regression model does not focus on other potentially important variables such as household income, market access, education level, and access to agricultural inputs or government support programs. The omission of such variables may introduce bias into the estimates. Therefore, in a future study, if researchers include these socio-economic and institutional variables, it will help to clarify the mechanisms through which environmental and demographic factors interact with food security.
Second, it is worth noting that the results of this study should not be interpreted as establishing a causal relationship between environmental factors and household food security. That’s because our empirical analysis is based on cross-sectional observational data rather than experimental or longitudinal designs. Therefore, while we identify statistically significant associations between vegetation and food security, we cannot rule out the influence of omitted variable bias, measurement error, or reverse causality. These results are purely correlational and should not be interpreted as causal. To make causal interpretations, future research needs to focus on experimental or quasi-experimental methods.
Appendix
Figure 4: Map showing the income distribution of Nigeria
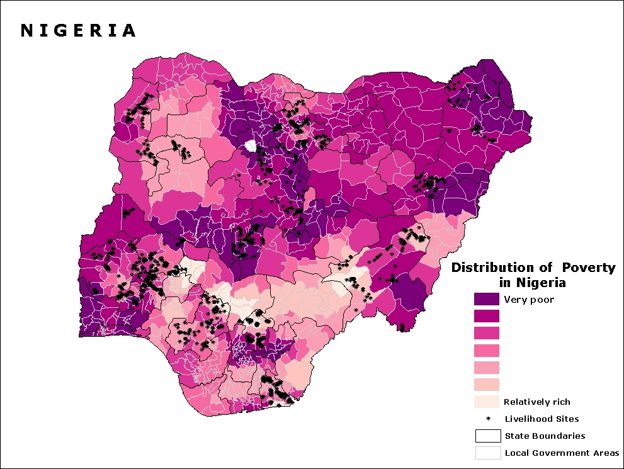
Note: Sourced from Institute for Income Poverty, Vitamin A and Iodine in Nigeria (2025)
Figure 5: Map showing the climatic zones of Nigeria
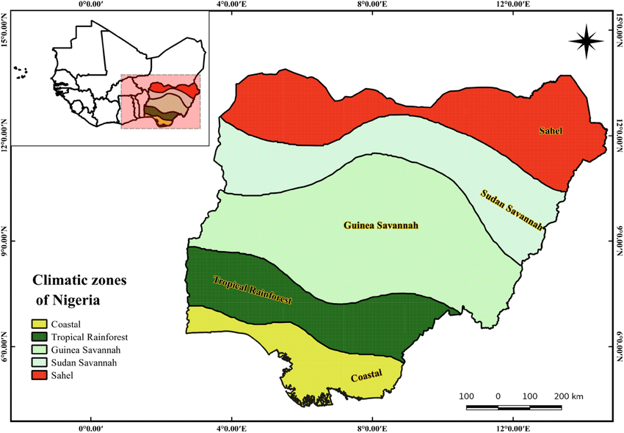
Note: Sourced from (Akinsanola and Ogunjobi 2014)
Figure 6: Estimated effects of NDVI on food purchased in Nigeria
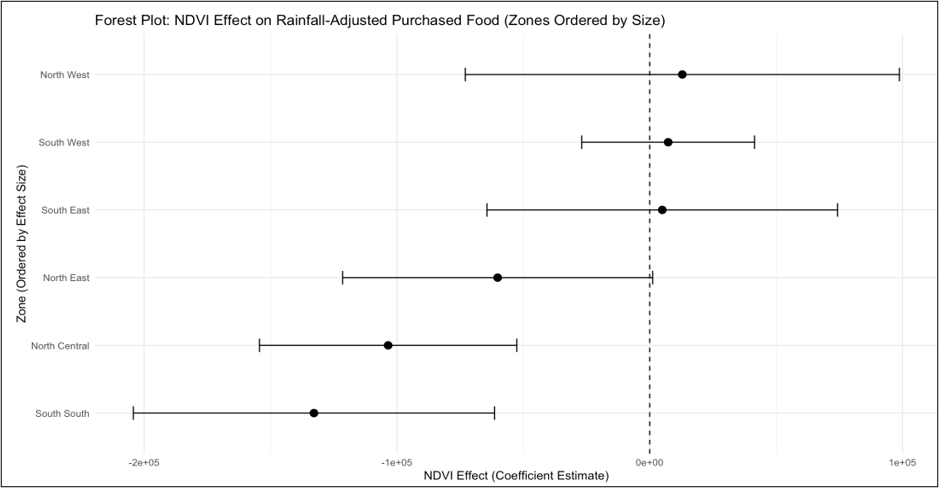
Note: The forest plot shows the estimated effects of NDVI on food purchased in Nigeria’s six zones. The dots are the coefficient estimate of NDVI by each region, and the lines represent the 95 percent confidence interval. A negative and statistically significant correlation is observed between NDVI and food purchased in South South and North Central and moderate effects are observed in North Eastern. Insignificant effects are observed in South East, South West and North West.
Figure 7: Estimated effects of NDVI on food grown in Nigeria
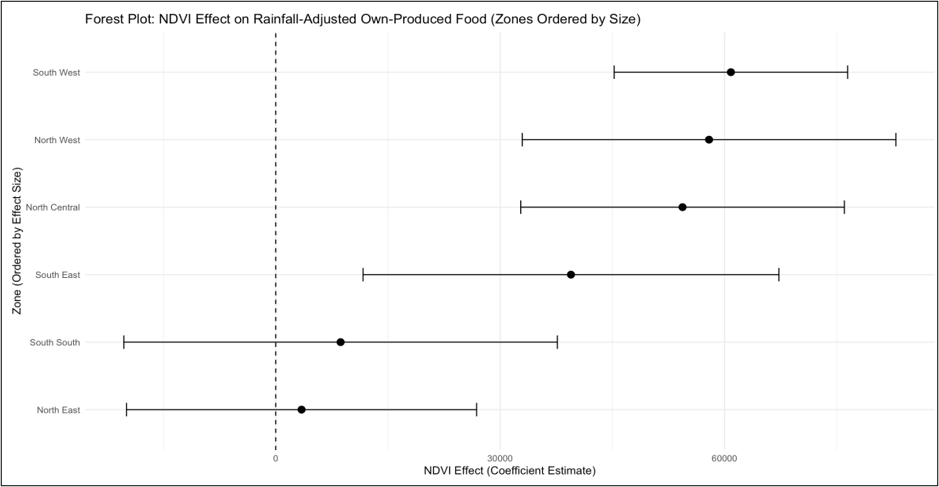
Note: The forest plot shows the estimated effects of NDVI on food grown in Nigeria’s six zones.
The dots are the coefficient estimate of NDVI by each region and the lines represent the 95 percent confidence interval. A positive and statistically significant correlation is observed between NDVI and own food grown South West, North West, and North Central, while the effect is weaker or insignificant in South East, South South, and North East.
Bibliography
Akinsanola, A., and K. Ogunjobi. 2014. “Analysis of Rainfall and Temperature Variability over Nigeria.” Global Journal of Human-Social Science: B Geography, Geo-Sciences, Environmental Disaster Management 14: 19. https://globaljournals.org/GJHSS_Volume14/1-Analysis-of-Rainfall-and-Temperature.pdf.
Akpa, A. 2021. Food Security Strategy in Nigeria: Is There Need for a Shift in Paradigm? Central Bank of Nigeria Economic and Financial Review. https://www.cbn.gov.ng/Out/2024/RSD/Food%20Security%20Strategy%20in%20Nigeria%20Is%20there%201.pdf.
Amare, Mulubrhan, Kibrom A. Abay, and Patrick L. Hatzenbuehler. 2023. “Spatial Market Integration during a Pandemic: Evidence from Food Markets in Nigeria.” Agricultural Economics. https://doi.org/10.1111/agec.12809.
Barnabas, Bulus, Miroslava Bavorova, and Mustapha Yakubu Madaki. 2024. “The Effect of School Feeding Program on Pupils’ Enrolment, Attendance and Performance in the North East Region of Nigeria.” SAGE Open 14(1). https://doi.org/10.1177/21582440241255809.
Bertoni, Eleonora, Michele Di Maio, Vasco Molini, and Roberto Nisticò. 2019. “Education Is Forbidden: The Effect of the Boko Haram Conflict on Education in North-East Nigeria.” Journal of Development Economics 141: 102249. https://doi.org/10.1016/j.jdeveco.2018.06.007.
Food and Agriculture Organization of the United Nations. 1996. World Food Summit: Final Report (Part 1). https://www.fao.org/4/w3548e/w3548e00.htm.
Food and Agriculture Organization of the United Nations. 2024. Measuring Capacity in Fisheries. https://www.fao.org/4/y4849e/y4849e0c.htm.
Institute for Income Poverty, Vitamin A and Iodine in Nigeria. 2025. CGIAR Country Case Study Metadata: Nigeria. http://gisweb.ciat.cgiar.org/povertymapping/metadata/nigeriacasestudy_faq.htm#what.1.
International Fund for Agricultural Development. 2014. Nigeria. https://www.ifad.org/en/w/countries/nigeria.
Johnson, Kiersten, and Molly E. Brown. 2014. “Environmental Risk Factors and Child Nutritional Status and Survival in a Context of Climate Variability and Change.” Applied Geography 54 (October): 209–21. https://doi.org/10.1016/j.apgeog.2014.08.007
Mayah, Emmanuel. 2017. Inequality in Nigeria: Exploring the Drivers. Oxfam. https://www-cdn.oxfam.org/s3fs-public/file_attachments/cr-inequality-in-nigeria-170517-en.pdf.
Mukhtar, Mustapha. 2020. “Examining the Impacts of Boko Haram Conflict and Food Security Status among Households in Kano Metropolis.” Lapai Journal of Economics 4(1).
Ohiolei, John Asekhaen, Hong-Bin Yan, Li Li, A. A. Magaji, Joshua Luka, Guoqiang Zhu, Clement Isaac, et al. 2019. “Cystic Echinococcosis in Nigeria: First Insight into the Genotypes of Echinococcus granulosus in Animals.” Parasites & Vectors 12(1). https://doi.org/10.1186/s13071-019-3644-z.
United Nations News. 2024. “Nigeria: 33 Million Could Face Hunger Next Year.” November 12, 2024. https://news.un.org/en/story/2024/11/1156876.
World Food Programme. 2024. “UN World Food Programme (WFP).” https://www.wfp.org/news/wfp-calls-urgent-life-saving-support-nigeria-33-million-people-face-food-insecurity-2025
World Bank. 2018. Nigeria – General Household Survey, Panel 2018–2019 (Wave 4). https://microdata.worldbank.org/index.php/catalog/3557.
World Bank Group. 2021. Nigeria Climate Risk Country Profile. https://climateknowledgeportal.worldbank.org/sites/default/files/2021-07/15918-WB_Nigeria%20Country%20Profile-WEB.pdf.