Volume 33, Issue 1: Paper 5
The WWI Draft and the Economic Status of Black Americans
Meredith Newman, American University
When the US joined WWI, African Americans saw it as an avenue to gain rights and respect. As of July 5th, 1917, a recorded 700,000 African Americans had registered to serve in the military (Delaware Historical & Cultural Affairs). Although they were restricted from certain branches and roles, thousands of Black men willingly risked their lives for a country that wouldn’t offer them basic human rights. After the war, they expected that their patriotism and service would lead to an improvement in equality and democracy domestically, especially since US involvement in WWI was framed as protecting democracy. However, they were sorely disappointed when they returned home, and little had changed. That said, there is research supporting the idea that WWII and WWI veterans in general were provided certain earnings benefits due to the human capital they gained by serving in the war. I will discuss this debate further in my literature review.
Meanwhile back home, agriculture in the south was changing post-bellum. Though slavery was abolished, labor segregation was very strong, especially after the end of the reconstruction era. Agriculture was one of the most open industries to Black workers, and new types of contacts became available to them. Tenant farming was the preferred contract because it provided property rights, job security, and greater autonomy over the crops. Sharecropping was a step down from tenant farming because it did not grant property rights to the farmer or his family. The least desirable arrangement was wage labor because wages were dependent on the crop yield, which was problematic for supporting a family. As a result, farmers with a family without enough social credit to work as a tenant farmer generally opted for sharecropping.[1] Though both Black and white people worked as sharecroppers, this form of agricultural work prevented newly freed Black southerners from owning their own land and accumulating wealth. Thus, the legacy of slavery continued through economic discrimination, inhibiting Black Americans’ opportunities to catch up to white prosperity.
In his book “Work or Fight!” Race, Gender, and the Draft in World War One, historian Gerald Shenk hypothesizes that the decentralized nature of the WWI draft allowed southern whites to use draft deferments as a form of control over Black farmers by excluding them from military service.[2] Although serving in the war could lead to their death, it could also be a pathway to greater social prestige and mobility if they returned. Shenk’s theory led me to hypothesize that predominantly Black counties may have received a disproportionate rate of agricultural deferments based on white farm owners’ desire to control their Black laborers. This paper explores this concept empirically by comparing the impact of agricultural deferments on median occupational prestige in counties with different proportions of Black residents. I find that while a higher rate of agricultural deferments is associated with an increase in occupational prestige controlling for other variables, the relationship is the opposite when a county has a higher Black population.
II. Background
The Selective Service Act was passed in May 1917 to recruit more soldiers for WW1. Local boards were established to handle registration and exemptions for each subdivision of up to 30,000 people. Deferments were granted to men in agriculture or industry whose work was deemed necessary to the war effort at home and men with wives or children dependent on their income.[3] The first registration was held on June 5th, 1917, for all men ages 21 through 31, and a second registration was held the following year on June 5th, 1918, for men who had turned 21 since the last registration. A third and final registration was held on September 12th, 1918, for men ages 18 through 45, but these men never served because the war ended two months later.[4] I thus exclude the third round of registration from my calculations. It is unclear whether the recorded total agricultural deferments include men who were drafted in September 1918, but I opted to exclude them from the total number of draft registrants because none of them saw military service.
III. Literature Review
The concept of a veteran premium has been researched by various economists to determine whether veterans receive higher wages or better economic outcomes. Much of this scholarship has focused on WWII. In their 2002 paper, Bound and Turner use a difference-in-difference method to regress educational attainment on veteran status for several cohorts and compare their estimates.[5] They find that veterans of WWII received between 0.15 and 0.52 more years of education than the cohort who did not serve in WWII, although the true effect of the G.I. Bill could be slightly reduced by accounting for Korean War veterans.
Teachman and Tedrow ask a similar question.[6] Using the National Longitudinal Study of Mature Men, they regress wages, earnings, and occupational prestige on veteran status. They find that WWII veterans do receive moderate income and occupational status premiums, and Black veterans with lower education levels have a higher premium, largely due to human capital accumulation associated with military experience. In my paper, I will ask a similar question of WWI but narrow my focus to Black and white agricultural workers.
Some literature focuses on the economic impacts of being a veteran by race. Bailey uses a 1% sample of working-age white and Black men between 1940 and 2000 from the U.S. population census to run a logistic regression of recent migration on veteran status.[7] She finds that being a veteran significantly increases the chances of migration for white veterans compared to white non-veterans, but that this phenomenon is not observed amongst Black veterans except between 1970 and 1980. She notes that the Great Migration overlaps with the period she is studying, which could explain the similar migration rates between Black veterans and non-veterans from 1940 to 1970. Additionally, she does not determine whether these findings lead to variation in social mobility. My research question will more directly address social mobility, as part of my hypothesis is that receiving agricultural deferments from WWI restricted social mobility.
Kleykamp uses an audited correspondence test to determine whether employers prefer candidates with or without military experience for entry-level white collar jobs.[8] She finds that for white applicants, there is no difference in callback rates between veterans and non-veterans, but for Black applicants, veterans with transferrable skills were preferred to non-veterans. Unfortunately, these results were not statistically significant due to the small number of audits conducted.
There are also some papers about the effect of WWI on veterans’ economic outcomes. Tan uses the Integrated Public Use Microdata Series for a difference in discontinuity and fuzzy regression discontinuity that estimates the impact of military service in WWI on occupational prestige.[9] He finds that military service has little effect on occupational prestige. Gabriel asks the same question but comes to a different conclusion.[10] He uses the same dataset as Tan but limits his data to 1930 through 1950 for an ordered-response logistic regression, finding that veterans of WWI were more likely to be employed in higher skilled jobs than non-veterans. He concludes that his results are consistent with the “Bridging Hypothesis”.
Fredland and Little look at the effects of WWII military service on future occupational prestige and earnings for different races.[11] Their goal was to test the Bridging Hypothesis, which says that military service builds skills that increase veteran earnings, particularly for minority groups. They find evidence to support the hypothesis, but their research indicates that the human capital benefits are stronger for white veterans than non-white veterans.
The current literature supports the idea that WWI deferments could hurt Black farmers. Being a veteran, at least in some generations, can come with educational, social, and economic benefits, and some of these benefits could work toward racial equality. It is less clear how much benefit veterans of WWI received because of a gap in the literature. My research aims to contribute to scholarship in this field using a largely unstudied phenomenon—draft deferments.
IV. Data Construction
For my research, I am using draft board data, population demographics, and income levels at the county level. I digitized comprehensive county-level data on the WWI draft, including the total number of drafted men and the number of each type of deferment granted within a county. This data came from a book called Uncle, we are ready!: Registering America’s men, 1917-1918 designed as a resource for Americans to learn more about their family history.[12]
To calculate county-level demographic data and occupational prestige scores, I use 1910 and 1920 Decennial Census microdata. As income data was not collected by the census until 1940, occupational prestige is the best available indicator of income and social status for the time. The Integrated Public Use Microdata Series contains all the data I need for my control variables at the individual level, so I aggregated them to the county level to match the draft data I am using.
V. Descriptive Statistics
To get an idea of the characteristics of US counties in the 1910’s, here are some descriptive statistics.
Table 1: County Descriptive Statistics
| Year | Variable | Obs | Mean | Std. Dev. | Min | Max |
|---|---|---|---|---|---|---|
| 1910 | Percent Black | 2922 | 13.01 | 21.65 | 0 | 100 |
| 1910 | Occupational Prestige | 2920 | 31.32 | 8.38 | 14.85 | 50.3 |
| 1910 | Metropolitan | 2922 | 4.69 | 21.24 | 0 | 1 |
| 1910 | Homeownership (percent) | 2922 | 55.47 | 18.61 | 0 | 1 |
| 1910 | Literacy Rate (percent) | 2922 | 67.61 | 12.24 | 24 | 1 |
| 1910 | School Attendance (percent) | 2922 | 24.17 | 6.41 | 0 | 66.67 |
| 1910 | Labor Force Participation (percent) | 2922 | 36.54 | 7.55 | 0 | 1 |
| 1920 | Percent Black | 3012 | 11.58 | 19.94 | 0 | 97.44 |
| 1920 | Occupational Prestige | 3011 | 35.42 | 6.59 | 17.5 | 50.3 |
| 1920 | Metropolitan | 3012 | 5.78 | 23.33 | 0 | 1 |
| 1920 | Homeownership (percent) | 3012 | 54.21 | 17.6 | 0 | 1 |
| 1920 | Literacy Rate (percent) | 3012 | 70.43 | 10.07 | 25 | 1 |
| 1920 | School Attendance (percent) | 3012 | 24.86 | 5.99 | 0 | 50 |
| 1920 | Labor Force Participation (percent) | 3012 | 34.21 | 6.75 | 0 | 1 |
| 1917 | Agriculture Deferments (percent) | 3018 | 1.89 | 2.76 | 0 | 20.64 |
As shown above, the average county in 1910 was 13% African American and ranged from 0% to 100% African American. The map below shows the distribution of these counties for 1910, with most counties outside of the south being predominantly white. Blank counties represent counties which have changed since 1910 and could not be reconciled with modern county data.
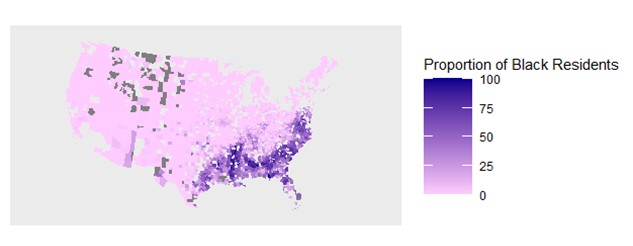
Proportion of Black Residents by County (1910)
The average county had a median occupational prestige score of 31.3. For reference, the Siegel Occupational Prestige Scores rank a cashier in a supermarket at 30.9, a bank teller at 46.6, a department head in the federal government at 84.6, and a sharecropper at 14.9. The lowest county’s median score was 14.85 and the highest was 50.3.
Just less than 5% of US counties in 1910 were classified as metropolitan. On average, 55% of a county’s residents lived in a dwelling they owned, and 68% could read. Additionally, the average county had a school attendance rate of 24% and a labor force participation rate of 37%.
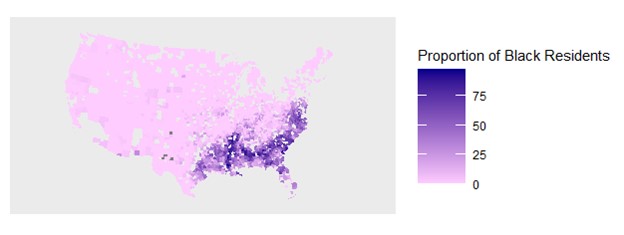
In 1920, the average county was 12% African American, a slight decrease from 1910. The overall distribution of Black Americans appears to have changed very little from 1910 based on the map below. Almost all counties outside the south are predominantly white.
Proportion of Black Residents by County (1920)
Median occupational prestige increased to 35.4 for the average county. The proportion of metropolitan counties also slightly increased to 5.8%. 57% of residents in the average county in 1920 lived in a dwelling they owned. Literacy rate increased to 70% of county residents, school attendance increased by less than a percent, and labor force participation fell to about 34% of county residents.
On average, just less than 2% of drafted men in a county were granted agricultural deferments, with the maximum given out being about 20% and the minimum being 0%. As seen in the map below, counties in the Midwest tended to receive higher rates of agricultural deferments. The southeast and southwest have the lowest rates of deferments overall, which was surprising considering how much agriculture took place in the southeast.
Distribution of WWI Agricultural Deferments
VI. Methodology
The models below seek to determine the relationship between agricultural deferments, racial demographics, and socioeconomic status. As my data is at the county level, my models cannot determine the effect of receiving an agricultural deferment on an individual, but they can speak to more aggregate effects using variation in county characteristics.
My first regression tests the relationship between racial makeup of a county and the rate of agricultural deferments it received. I expect to find that counties with a higher proportion of Black residents received a higher rate of agricultural deferments.
(1)$$\displaylines{AGRICULTURE\text{_}DEFERMENTS=\alpha+\beta\text{_}1PCT\text{_}BLACK+\beta_2METROPOLITAN+\\ \beta_5SCHL\text{_}ATTND+\beta_6LABFORCE+\ u}$$
In the above regression, agricultural deferments (AGRICULTURE_DEFERMENTS) are taken as a percentage of men drafted in a county. The percentage of Black residents (PCT_BLACK) is continuous term, identifying a county’s Black population as a percent of the total county population. The next variables are controls that will be aggregated to the county level. These include labor force participation rate (LABFORCE), homeownership rate (HOMEOWNER), and school attendance rate amongst school aged residents (SCHL_ATTND). I will run this regression using 1920 data.
My second regression is meant to test whether agricultural deferments are associated with an increase or decrease in median occupational prestige. I hypothesize that as the percentage of agricultural deferments increases, the median occupational prestige score will fall, and that this relationship will be stronger (or a larger magnitude) for counties with more Black residents.
(2)$$\displaylines{OCC\text{_}PRES=α+ β_1 AGRICULTURE\text{_}DEFERMENTS+β_2 PCT\text{_}BLACK+\\ β_3 (AGRICULTURE\text{_}DEFERMENTS)(PCT\text{_}BLACK)+ β_4 HOMEOWNER+ \\ β_5 SCHL\text{_}ATTEND+β_6 LABFORCE+ u}$$
In the above regression, occupational prestige (OCC_PRES) is taken as the median of the county residents. As income was not recorded by the US census until 1940, occupational prestige scores are an available estimate of one’s socioeconomic standing based on their reported occupation. All other variables are defined in the same way as the first regression. I will run this regression using 1920 data. Using my interaction term between agricultural deferment rate and percentage of Black residents, I can calculate the difference in deferments’ impact on occupational prestige scores between predominantly Black and predominantly white counties, i.e., the degree to which Black Americans were affected differently from white Americans by WWI agricultural draft exemptions.
My third regression is a variation on the previous regression looking at 1910 data and excluding deferments. I expect that counties with more Black residents will have lower median occupational prestige scores as most of these counties were in the south and largely agricultural.
(3)$$\displaylines{OCC\text{_}PRES=\alpha+\ \beta_1PCT\text{_}BLACK+\ \beta_2HOMEOWNER+\\ +\ \beta_3SCHL\text{_}ATTND+\beta_4LABFORCE+\ u}$$
These variables are the same as above, however they use observations from 1910. I removed deferments from the regression because they don’t happen until 1917 and 1918, so they could not affect the occupational prestige of a county in 1910.
VII. Empirical Results
To check the first component of my hypothesis—that predominately Black counties received a disproportionate rate of agricultural deferments—I use the following linear regression model:
(1)$$\displaylines{AGRICULTURE\text{_}DEFERMENTS=\alpha+\beta_1PCT\text{_}BLACK+\beta_2METROPOLITAN+\\ \beta_5SCHL\text{_}ATTND+\beta_6LABFORCE+\ u}$$
AGRICULTURE_DEFERMENTS represent the percent of drafted men granted agricultural deferments in a given county, and PCT_BLACK represents the percent of county residents who are Black. METROPOLITAN is a dummy variable that tells whether the county is part of a metropolitan area, SCHL_ATTND provides the percent of school-age county residents who are currently in school, and LABFORCE represents the labor force participation rate of the county.
Contrary to the hypothesis, there is a negative correlation between the percent of Black residents in a county and the number of agricultural deferments it received. These results were not affected by adding or removing multicollinear control variables. This suggests that counties with a higher white population were granted higher rates of agricultural deferments in general. Given how rural the country was in 1910 and 1920, it makes sense that many regions of the country would have agricultural workers, not just the south. Although this was my hypothesized mechanism of inequality, my next regression points to something else.
To determine the relationship between agricultural deferments, race, and occupational prestige, I constructed the following regression with an interaction term:
(2)$$\displaylines{OCC_PRES=\alpha+\ \beta_1AGRICULTURE\text{_}DEFERMENTS+\beta_2PCT\text{_}BLACK+\\ \beta_3(AGRICULTURE\text{_}DEFERMENTS)(PCT\text{_}BLACK)+\ \beta_4HOMEOWNER+\\ +\ \beta_5SCHL\text{_}ATTND+\beta_6LABFORCE+\ u}$$
The variables are the same as above with the addition of occupational prestige and homeownership. I am using the Siegel 1971 occupational prestige codes because they are a good estimator of relative social prestige, which I expect to change less over time than the salary affiliated with a job. Compared to other indicators of socioeconomic status available in the 1910 and 1920 decennial censuses, Siegel’s scores were the most comprehensive and applicable to the past. I switched my metropolitan variable with my homeowner variable because of coliniarity between agricultural deferments and metropolitan status.
Table 2: Regression Results: Race, Occupational Prestige, and Deferments
| Explanatory Variables (Adjusted R-Squared) |
Agricultural Deferments (0.0967) |
Occupational Prestige 1910 (0.3883) |
Occupational Prestige 1920 (0.2404) |
|---|---|---|---|
| Percent Black | -0.04*** (-16.55) |
-0.18*** (-28.63) |
-0.085*** (-12.84) |
| Agriculture Deferments | —– | —– | 0.4*** (9.36) |
| Percent Black*Agriculture Deferments |
—– | —– | -0.0078* (-1.7) |
| Metropolitan | -1.66*** (-7.82) |
—– | —– |
| Homeownership | —– | 8.35*** (10.91) |
3.95*** (5.78) |
| School Attendance | -1.12 (1.19) |
-2.48 (-1.12) |
-0.55 (-0.25) |
| Labor Force Participation | -0.03 (0.04) |
-15.96*** (-8.5) |
-22.6*** (-11.73) |
Significant at 1%***, 5%**, 10%*
This model found that on their own, counties with more agricultural deferments tended to have higher occupational prestige averages and that counties with higher proportions of Black residents saw lower occupational prestige averages, both estimates being statistically significant at the 1% confidence level. However, the estimated coefficient of the interaction term between agricultural deferments and percent Black residents was negative and statistically significant at the 10% confidence level. This says that given a county with a certain proportion of Black residents, an increase in agricultural deferments will further decrease expected median occupational prestige, and for a county with a given rate of agricultural deferments, having more Black residents will decrease expected median occupational prestige.
For 1910, we see the same general trends. There is a negative significant relationship between a county’s proportion of Black residents and their median occupational prestige. School attendance is not statistically significant, just as above. Homeownership has a positive significant relationship with occupational prestige, and labor force participation rate has a negative significant relationship with it.
VIII. Discussion
The distribution of agricultural deferments seen in map 3 is surprising, but could be explained by another type of deferment. Dependency deferments were granted to men who had a wife or children dependent on their income to survive. The midwest, which had the highest rates of agricultural deferments, also had a strongly skewed sex ratio. Because there were significantly more men than women, there would have been fewer men with wives and families to receive dependency deferments. Perhaps this led to the higher rate of agricultural deferments—local boards were more willing or able to provide other kinds of deferments to make up for the fewer dependency deferments.
In general, counties with more white residents received higher proportions of agricultural deferments associated with higher socioeconomic status, but those with more Black residents saw that an increase in agricultural deferments was associated with lower socioeconomic status. This finding supports the crux of my hypothesis—that agricultural deferments had a negative impact on African Americans’ socioeconomic status. More interestingly, it found the opposite effect in predominantly white counties, which is a very clear sign of inequality.
Perhaps the reason agricultural deferments deferments had different effects on different racial demographics had to do with the system of agriculture being practiced. Sharecropping was prevalent in the south throughout the time period I am studying. It arose in the 1870s as a post-slavery institution that maintained economic control over many Black workers and famillies. As mentioned above, sharecropping has one of the lowest possible prestige scores because the workers are essentially in a feudal arrangement with the landowner; they rent the land they live and work on and pay for it with a portion of their harvest. This system allowed sharecroppers to subsistence farm but made it impossible for them to accumulate any wealth that would grant economic mobility. The goal was to entrench and restrict Black workers in a similar fashion to slavery. This system would also explain the negative relationship between a county’s Black population and median occupational prestige. Outside of the south, sharecropping was not the agricultural model. Most farmers may not have been wealthy, but they had more economic mobility than sharecroppers. Understanding the reason predominantly white counties benefited economically from agricultural deferments may require future research with a larger scope.
IX. Conclusion
This paper seeks to determine whether agricultural deferments from the WW1 draft increased racial economic inequality. According to my findings, these deferments had a positive socioeconomic effect on predominantly white counties, but for counties with more Black residents, more deferments led to a decrease in median occupational prestige. In other words, agricultural deferments had a negative impact on Black farmers’ economic status and a positive impact on white farmers’ economic status. This finding provides strong support for my hypothesis. However, further research could uncover the specific mechanism behind this inequality which my paper cannot explain. My paper’s ability to draw conclusions was limited by the lack of income data available for the time and the fact that the census data was recorded in 1910 and 1920, while the draft data is from 1917-1918. If demographic data was available just before and shortly after the draft, isolating the change in economic status caused by the war would have been easier.
This research could be expanded using a longitudinal study of economic prestigue to explain the lifetime effects of receiving an agricultural deferment. Additionally, individual-level data rather than county-level data could yield stronger conclusions about this phenomenon, perhaps using difference-in-difference methodology. The details of WWI draft deferments and their consequences require further study. Exploring the relationship between military service, race, and class provides a better picture of our history and has implications for modern social and political dynamics
X. Appendix
| Variable name | Definition | Data Source |
|---|---|---|
| occupational prestige score | Median score amongst residents of the county | IPUMS database: Occupational prestige score, Siegel https://usa.ipums.org/usa-action/variables/PRESGL#description_section |
| agricultural deferments | Calculated as a percent of men drafted in the county | Uncle, we are ready! by John Newman |
| percent black | Percentage of county residents who are Black | IPUMS database: Race https://usa.ipums.org/usa-action/variables/RACE#description_section |
| Metropolitan | Identifies whether the county is part of a metropolitan area (binary variable) | IPUMS database: Metropolitan status https://usa.ipums.org/usa-action/variables/METRO#description_section |
| ownership | Percentage of county residents who own their housing unit | IPUMS database: Ownership of dwelling (tenure) https://usa.ipums.org/usa-action/variables/OWNERSHP#description_section |
| school attendance | Percentage of county residents who attended school at a given time | IPUMS database: School attendance https://usa.ipums.org/usa-action/variables/SCHOOL#description_section |
| Labor force | Labor force participation rate for the county | IPUMS database: Labor force status
https://usa.ipums.org/usa-action/variables/LABFORCE#description_section |
XI. References
“African-American Participation During WWI.” Delaware Historical & Cultural Affairs, https://history.delaware.gov/world-war-i/african-americans-ww1/
Bailey, Amy Kate. 2011. “Race, Place, and Veteran Status: Migration among Black and White Men, 1940-2000.” Population Research and Policy Review, vol. 30, no. 5 (Oct): 701–28. https://doi.org/10.1007/s11113-011-9207-4.
Fredland, J. Eric, and Roger D. Little. 1985. “SOCIOECONOMIC STATUS OF WORLD WAR II VETERANS BY RACE: AN EMPIRICAL TEST OF THE BRIDGING HYPOTHESIS.” Social Science Quarterly 66, no. 3: 533–51. http://www.jstor.org/stable/42861942.
Gabriel, Paul E. 2020. “An Empirical Examination of the Occupational Attainment of American Veterans of World War I.” Social Science Quarterly, vol. 101, no. 3: 1009–17. https://doi.org/10.1111/ssqu.12746.
Kleykamp, Meredith. 2009. “A Great Place to Start?: The Effect of Prior Military Service on Hiring.” Armed Forces & Society, vol. 35, no. 2 (Jan): 266–85. https://doi.org/10.1177/0095327X07308631.
Newman, John J. 2001. Uncle, we are ready!: Registering America’s men, 1917-1918 : a guide to researching World War I draft registration cards. North Salt Lake, Utah: Heritage Quest.
Shenk, Gerald E. 2005. “Work or Fight!” Race, Gender, and the Draft in World War One. Palgrave Macmillan.
Steven Ruggles, Sarah Flood, Matthew Sobek, Daniel Backman, Annie Chen, Grace Cooper, Stephanie Richards, Renae Rogers, and Megan Schouweiler. IPUMS USA: Version 14.0 1910 1% Sample. Minneapolis, MN: IPUMS, 2023. https://doi.org/10.18128/D010.V14.0
Steven Ruggles, Sarah Flood, Matthew Sobek, Daniel Backman, Annie Chen, Grace Cooper, Stephanie Richards, Renae Rogers, and Megan Schouweiler. IPUMS USA: Version 14.0 1920 1% Sample. Minneapolis, MN: IPUMS, 2023. https://doi.org/10.18128/D010.V14.0
Tan, Hui Ren. 2020. “Did Military Service during World War I Affect the Economic Status of American Veterans?” Explorations in Economic History, vol. 75 (Jan): 10 –301. https://doi.org/10.1016/j.eeh.2019.101301.
Teachman, Jay, and Lucky M. Tedrow. 2004. “Wages, Earnings, and Occupational Status: Did World War II Veterans Receive a Premium?” Social Science Research, vol. 33, no. 4 (Dec): 581–605. https://doi.org/10.1016/j.ssresearch.2003.09.007.
Turner, Sarah and John Bound. 2002. “Closing the Gap or Widening the Divide: The Effects of the G.I. Bill and WWII on the Educational Outcomes of Black Americans.” National Bureau of Economic Research, (Jul): 1–46 https://doi.org/10.3386/w9044.
“World War I Draft: Topics in Chronicling America.” Library of Congress, https://guides.loc.gov/chronicling-america-wwi-draft
Wright, Gavin. 2013. “The Political Economy of the Jim Crow South.” In Sharing the Prize, 32–73. The Economics of the Civil Rights Revolution in the American South. Harvard University Press. https://doi.org/10.2307/j.ctvjf9v9z.5.
XII. Endnotes
[1] Wright, Gavin. 2013. “The Political Economy of the Jim Crow South.” In Sharing the Prize, 32–73. The Economics of the Civil Rights Revolution in the American South. Harvard University Press. https://doi.org/10.2307/j.ctvjf9v9z.5.
[2] Shenk, Gerald E. 2005. “Work or Fight!” Race, Gender, and the Draft in World War One. Palgrave Macmillan.
[3] “Selective Service Regulations.” 1917. Government Printing Office.
[4] “World War I Draft: Topics in Chronicling America.” Library of Congress, https://guides.loc.gov/chronicling-america-wwi-draft
[5] Turner, Sarah and John Bound. 2002. “Closing the Gap or Widening the Divide: The Effects of the G.I. Bill and WWII on the Educational Outcomes of Black Americans.” National Bureau of Economic Research, (Jul): 1–46 https://doi.org/10.3386/w9044.
[6] Teachman, Jay, and Lucky M. Tedrow. 2004. “Wages, Earnings, and Occupational Status: Did World War II Veterans Receive a Premium?” Social Science Research, vol. 33, no. 4 (Dec): 581–605. https://doi.org/10.1016/j.ssresearch.2003.09.007.
[7] Bailey, Amy Kate. 2011. “Race, Place, and Veteran Status: Migration among Black and White Men, 1940-2000.” Population Research and Policy Review, vol. 30, no. 5 (Oct): 701–28. https://doi.org/10.1007/s11113-011-9207-4.
[8] Kleykamp, Meredith. 2009. “A Great Place to Start?: The Effect of Prior Military Service on Hiring.” Armed Forces & Society, vol. 35, no. 2 (Jan): 266–85. https://doi.org/10.1177/0095327X07308631.
[9] Tan, Hui Ren. 2020. “Did Military Service during World War I Affect the Economic Status of American Veterans?” Explorations in Economic History, vol. 75 (Jan): 10 –301. https://doi.org/10.1016/j.eeh.2019.101301.
[10] Gabriel, Paul E. 2020. “An Empirical Examination of the Occupational Attainment of American Veterans of World War I.” Social Science Quarterly, vol. 101, no. 3: 1009–17. https://doi.org/10.1111/ssqu.12746.
[11] Fredland, J. Eric, and Roger D. Little. 1985. “SOCIOECONOMIC STATUS OF WORLD WAR II VETERANS BY RACE: AN EMPIRICAL TEST OF THE BRIDGING HYPOTHESIS.” Social Science Quarterly 66, no. 3: 533–51. http://www.jstor.org/stable/42861942.
[12] Newman, John J. 2001. Uncle, we are ready!: Registering America’s men, 1917-1918 : a guide to researching World War I draft registration cards. (North Salt Lake, Utah: Heritage Quest, 2001).