Volume 34, Issue 1: Paper 1
Does Travelling the World Widen the Gap? A Panel Data Analysis of the Effect of International Tourism Revenue on Income Inequality
In the era of globalisation, rapid growth in international tourism has boosted national economies, shaping the income distribution among local populations.
This paper aims to investigate the relationship between international tourism revenue and income inequality of a range of developed and developing countries. Between 2000 and the Covid-19 pandemic, the number of international tourist visits more than doubled (Herre et al., 2023). Many countries implemented policies to deliberately increase inbound tourism in this period (Tosun et al., 2003; South African Government, 2023). There has also been a recovery in international tourism following a downturn due to the Covid-19 pandemic (World Travel and Tourism Council, 2021). Given the recent growth and recovery of tourism, the tourism industry is relevant to governments, policymakers and businesses because it contributes a significance source of income to countries and affects the income of people within countries that experience and promote international tourism.
This impact of international tourism on income inequality is specifically important because many developing countries rely on the tourism sector for job and income creation, as well as poverty alleviation (Croes, 2014). For developed countries, tourism-related sustainable growth is increasingly a priority (OECD, 2017). Cole and Morgan (2010) outline how ensuring that the benefits of tourism are seen by low-income people in developing countries and social tourism in developed countries can both reduce inequality. Belgium, Brazil, Colombia, Italy, South Korea and Uruguay have all implemented policies that aim to increase tourism sustainably and utilise it as a policy tool to reduce inequality (Godin, 2017). The tourism-inequality relationship is thus crucial in evaluating the success of tourism policies and assessing the wider impact of increasing tourism on countries.
The contribution of this paper is twofold: firstly, updating the current research on the tourism-income inequality by five years using the most recent data available which includes the Covid-19 effect and recovery; secondly, exploring the effect of international tourism on inequality through the informal economy, a channel that has not yet been fully researched (only partially in Lv’s (2020) analysis of the effect of tourism on the informal sector). The informal sector plays an important role in the relationship between tourism and inequality because many people work in the tourism sector informally. If tourism is responsible for income inequality, then the most recent understanding of this relationship considering the role of the informal sector will allow countries to adopt policies that aim to alleviate inequality in tourism-dependent countries today.
Prior empirical research has found both a positive and negative relationship between tourism and income inequality (Wang and Tziamalis, 2023; Chi, 2021). Tourism could plausibly decrease income inequality through employment, growth and redistribution (Njoya and Seetaram, 2018; De Vita and Kyaw, 2017; Carrascal Incera and Fernández, 2015). Alternatively, tourism could increase income inequality due to seasonality or price increases (Baum and Hagen, 1999; Carrascal Incera and Fernández, 2015). As such, the current understanding of the effect of international tourism on the income inequality of a country is mixed and unclear. Thus, this paper additionally attempts to clarify this relationship.
In the next section, the literature on tourism and income inequality will be reviewed. In II, the methodologies used in this paper will be outlined and justified. A summary of the data used will be in III. IV will analyse the results of this study. Finally, this paper will provide conclusions, limitations and possible future extensions of this research.
I. Literature Review
In theory, the spending of international tourists in a country – international tourism revenue of the country – impacts the income of people in this country, thus affecting country-level income and income distribution. In recent decades, several empirical studies have debated the relationship between international tourism and income inequality. Some found mixed results (Wang and Tziamalis, 2023; Chi, 2021); some found that tourism increases income inequality (Alam and Paramati, 2016; Mahadevan and Suardi, 2019); and others concluded tourism decreases inequality (Nguyen et al., 2021).
The seasonality of tourism has adverse effects on the income of those employed in the tourism sector, worsening country income inequality according to Baum and Hagen (1999) and Fernández-Morales et al. (2016). In addition, increases in tourism spending increase demand and prices in a country, also increasing income inequality (Carrascal Incera and Fernández, 2015). In single-country analyses, Oviedo-García et al. (2019) and Uzar and Eyuboglu (2019) find that tourism increases income inequality in Dominican Republic and Turkey, respectively.
On the other hand, Nguyen et al. (2021) find evidence of a negative relationship between international tourism and country-level income inequality whilst accounting for cross-sectional dependence. Njoya and Seetaram (2018) further argue that tourism sectors offer higher-wage employment alternatives to poorer people, increasing their income and reducing income inequality. Regionally, Kinyondo and Pelizzo (2015) conclude that tourism decreases inequality in Tanzania, and Li et al. (2016) contend the same conclusion in China.
A well-researched channel through which international tourism revenue has been found to affect the income inequality of a country either positively or negatively is the ‘tourism-led growth hypothesis’. This hypothesis is that increases in tourism revenue increase employment, demand and production in a country leading to an increase in national economic growth (De Vita and Kyaw, 2017; Brida et al;, 2016; Balaguer and Cantavella-Jorda, 2002; Paramati et al., 2017). Tourism-led growth then affects income inequality through higher tax revenues, redistribution policies (Carrascal Incera and Fernández, 2015; Gooroochurn and Milner, 2005), or investment in public services. Wang and Tziamalis (2023) also display a mixed tourism-inequality relationship using a dynamic panel threshold method to show that tourism decreases income inequality in developing countries, but increases it in developed ones. The same conclusion that this relationship also varies by country is drawn by Chi (2021), who finds that tourism increases income inequality in developing countries, and decreases it in developed ones. Additionally, Alam and Paramati (2016) argue that there is a ‘tourism-related Kuznets curve’; tourism increases income inequality, but reduces it if tourism doubles.
Above all, the mechanisms behind the impact of tourism on income inequality demonstrated confirm the plausibility of the relationship. However, the informal sector also plays an important role because many people in the tourism sector work informally, especially in countries with large tourism sectors. Lv (2020) argues that there is a U-shaped relationship between tourism and the share of the informal economy; the share of the informal economy falls as tourism initially increases, then increases as tourism continue to increase. However, this relationship between tourism and the informal economy has not yet been extended to the tourism-inequality relationship, which this paper will do.
Finally, the overarching takeaways from the existing literature on the tourism-inequality relationship are that regardless of whether panel data or single-country time series analyses, there is a mixed consensus on the relationship, and that this variation in findings depends on the empirical study and country factors, particularly development.
II. Methodology
The impact of international tourism on income inequality will be assessed in this paper using a panel regression model in order to consider the effect over time and across a range of countries. The Gini coefficient is used to measure the outcome variable of income inequality and is a measure of the distribution of income within a country. TR represents the explanatory variable of international tourism revenue, defined as the total inbound tourism spending within a country by international tourists. A range of control variables are also used in this model, represented by X. GINI, TR and X are each for country i and year t. Following numerous empirical studies (Alam and Paramati, 2016; Nguyen et al., 2021; Lv, 2019), αi accounts for country fixed-effects, and deals with heterogeneity between countries and biases due to country-specific and time-invariant factors. As such, the baseline equation used to estimate the effect of tourism on income inequality in this paper is as follows:
GINIit = β0 + β1 ∗ TRit + σ ∗ Xit + αi + ϵit (1)
However, there is a possibility of cross-sectional dependence in equation (1) that arises due to the interdependence of countries and mutual susceptibility of heterogeneous countries to shocks. This is empirically asserted by Nguyen et al. (2021) and confirmed by the result of the test in Appendix D of strong evidence of cross-sectional dependence (Pesaran, 2004). Thus, Driscoll-Kraay standard errors are used. These are heteroscedasticity-consistent (of which there is also evidence shown in Appendix C), robust to cross-sectional dependence, and especially relevant for smaller time frames (Driscoll and Kraay, 1998). The Driscoll-Kraay fixed effects (DK-FE) estimation is the first baseline model in this paper and denoted as (1A), (2A), (3A-C) and (4A).
The causality of the effect of tourism on income inequality in equation (1) is however challenged by endogeneity concerns. That is, there could be unobserved variables that affect both the explanatory and dependent variable; policies that stimulate tourism in a specific region of a country increase its international tourism revenue, as well as income inequality within the country. Reverse causality could also be a source of endogeneity, with bidirectional causality (Raza and Shah, 2017). This could be explained by international tourists being attracted to a country with high income inequality because of its high inequality in order to decrease it, meaning that the income inequality of a country increases its international tourism revenue. Therefore, the strategy and model in this paper is extended to include a system-generalised method of moments (GMM) estimation to reduce endogeneity concerns, and account for the model’s dynamic nature due to the dependence of current levels of income inequality on past levels. System-GMM estimation is preferred to other GMM methods and controls for endogeneity biases from omitted variables and reverse causality by using suitably lagged levels of the dependent variable as instruments for the first-differenced equation and suitably lagged first differences of exogenous regressors as instruments for the levels equation (Arellano and Bond, 1991; Blundell and Bond, 1998; Roodman, 2009). Due to the presence of endogeneity bias in equation (1) and the importance of controlling for endogeneity to reduce causality concerns, this GMM estimation serves as the second and preferred model used and identified by (1B), (2B), (3D-F) and (4B).
Additional analysis in this paper includes introducing interaction terms between i) international tourism revenue and the share of the informal economy of a country due to both the relevance of this factor in this relationship and the absence of it in existing empirical studies, and ii) international tourism revenue and a dummy variable for OECD countries due to the importance of country development in existing studies. This modification and additional analysis are displayed in model (2) below:
GINIit = β0 + β1∗TRit + β2∗OECDit∗TRit + β3∗INFit∗TRit + σ∗Xit + αi + ϵit (2)
Both of the DK-FE and GMM models are modified to include this additional analysis using interaction terms, referred to as (2A) and (2B), respectively. Robustness checks are also carried out and referred to as models (3) and (4).
III. Data
A full list of countries included in this analysis and a list of the variables, definitions and sources are provided in Appendix A and B.
A. Income Inequality International Tourism Revenue & Controls
The sample dataset for this paper includes 56 countries from 2005 to 2021 due to data availability and to examine the period of large growth in international tourism. This translates to 952 observations for the main results. The Gini coefficient for income inequality of disposable, post-tax income within a country is the outcome variable, on a scale from 0 to 100, where 0 reflects perfect equality of disposable income within a country and 100 represents complete inequality. This data comes from the Standardized World Income Inequality Database (SWIID) 9.5 (Solt, 2020), which is multiply imputed – measured by 100 separate variables for each country and year – so missing data is reduced. The post-tax Gini coefficient for income inequality also allows redistribution and taxation policies to be taken into account.
UN Tourism (2023) is the source of data for the explanatory variable, that is, the total inbound tourism spending within a country by international tourists, which comes from the balance of payments of a country; likely to be an accurate source. This is equivalent to the international tourism revenue of a country, and is referred to as such in this paper. It is measured in US dollars and the natural logarithm of international tourism revenue is used in this study.
The control variables come from the World Bank (2024) World Development Indicators (WDIs), and are GDP per capita, government effectiveness, education, labour force participation, unemployment, inflation, and a Covid-19 dummy variable. Of these, GDP per capita and labour force participation are in the natural logarithm form. Government effectiveness is an aggregate estimator of the quality of a country’s public services, civil service, independence from political pressure, policymaking and government credibility on a scale from -2.5 to 2.5. Education is expected education level measured by compulsory years of school in a country, and the Covid-19 dummy variable is equal to 1 if the year is 2020 or 2021 and 0 otherwise to control for the effect of Covid-19.
B. Interaction Terms & Robustness Variables
Additional analysis with interaction terms to take into account the role of the informal sector and country development use a dummy variable equal to 1 if the country is an OECD country and 0 otherwise, and a measure of the informal economy share. The World Bank Informal Economy Database supplies the estimate of informal output as a proportion of total official GDP of a country (Elgin et al., 2021). This is estimated using a dynamic general equilibrium model, however, and due to the nature of the variable, is difficult to gauge exactly, which could result in a measurement error in the form of an underestimate. The data available for these regressions is for 55 countries from 2005-2020, resulting in 880 and 825 observations for the DK-FE and GMM estimations, respectively. Although lower, this still reflects the main sample and further fulfils the contributions of this paper.
Alternative measurements of income inequality are used as robustness tests. These are ratios of income percentiles of a country, constructed from income percentile data from the WDIs and supplemented with income percentile ratio data from the OECD (2023) due to data availability. The measures are the palma ratio (richest 10 percent to poorest 40 percent), decile ratio (richest 10 percent to poorest 10 percent), and quintile ratio (richest 20 percent to poorest 20 percent) with sample sizes of 690 for the DK-FE regression and 644 for the GMM regression, both from 2006-2020. The final robustness test is the removal of countries which may be outliers on the basis that they have low international tourism revenue (a maximum international tourism revenue lower than the 25th percentile), low international tourism revenue growth (a growth rate lower than the 10th percentile) or negative international tourism revenue growth, as these countries are less likely to prioritise tourism or its effect on income inequality. These thresholds are in Appendix F and the sample sizes are 833 and 784 for these DK-FE and GMM robustness tests.
C. Exploratory Analysis
The summary statistics for the data are in Appendix E. Appendix G displays the aggregate average growth rate in international tourism revenue (before logarithmic transformation) from the start of the sample in 2005 to the end of the sample excluding the Covid-19 years, and is very large at 97 percent.
In order to explore preliminary trends and correlations in variables, the mean values of income inequality and the natural logarithm of international tourism revenue are graphed over time in Figures 1-3; for the whole sample in Figure 1, non-OECD countries in Figure 2, and OECD countries in Figure 3. All three graphs confirm that aggregate international tourism revenue increased in the period from 2005 to 2019 (just before Covid-19 and the end of the sample). Figure 1 also shows that aggregate income inequality trends downwards from 2005-2021, implying a negative correlation between international tourism revenue and income inequality. This trend is also evident in non-OECD countries in Figure 2. On the other hand, income inequality increases on aggregate, before decreasing in the sample OECD countries in Figure 3. These figures demonstrate that the correlation between international tourism revenue and income inequality is mixed, and differs for countries dependent on their level of development. However, only correlations between the variables are displayed in Figures 1-3, rather than a causal impact of tourism on income inequality. In the next section, the relationship between tourism and income inequality will be empirically investigated using the methodologies outlined in II to assess evidence of an impact of international tourism revenue on income inequality.
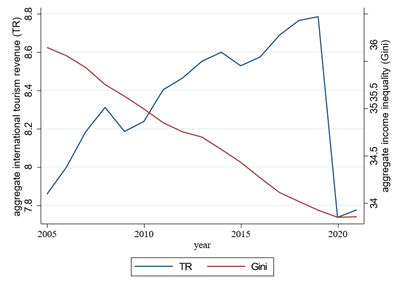
Figure 1: Aggregate trends in international tourism revenue and income inequality, 2005-2021
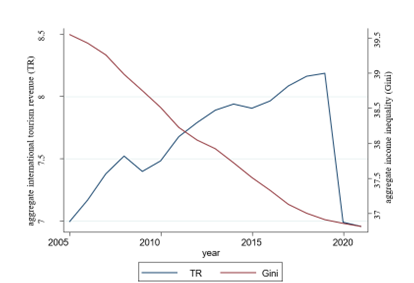
Figure 2: Aggregate trends in international tourism revenue and income inequality in non-OECD countries, 2005-2021
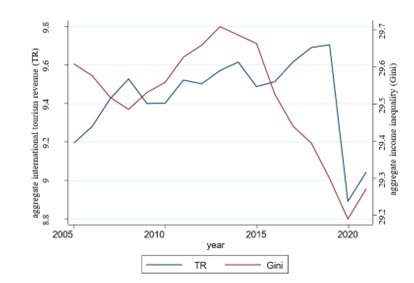
Figure 3: Aggregate trends in international tourism revenue and income inequality in OECD countries, 2005-2021
IV. Results & Analysis
A. Main Results
Table 1 displays the results of the regression for both the DK-FE and GMM estimations, (1A) and (1B). With a statistically insignificant coefficient on international tourism revenue in (1A) (controlling for just heterogeneity and cross-sectional dependence), there is evidence of a positive effect of international tourism revenue on income inequality in (1B) (also controlling for endogeneity), which is statistically significant at the 5 percent level. The coefficient on the international tourism revenue variable in (1B) is 1.222, which translated to a percentage increase in international tourism revenue increasing income inequality relatively largely given the scale of the Gini coefficient by 0.012. This outcome supports the positive relationship between international tourism revenue and income inequality of Alam and Paramati (2016). Explanations for this observed result could be those discussed in the literature; price increases or seasonality decrease the disposable income of locals and tourism workers, increasing income inequality (Carrascal Incera and Fernández, 2015; Baum and Hagen, 1999). Also, increases in tourism revenue could increase income inequality due to redistribution policies through the corruption of high-income officials or political factors.
The results in Table 1 also show a variation between the DK-FE and GMM methodologies. Despite statistical insignificance of the international tourism variable in (1A), Model F-test results in Appendix H show strong evidence that both the DK-FE and GMM models are valid specifications and do not require further alteration. Thus, endogeneity concerns due to omitted variables and reverse causality – or data availability – could justify the statistical insignificance in the DK-FE regression in Table 1. As the GMM methodology does control and reduce concerns for endogeneity, strengthening the evidence for a causal effect of international tourism revenue on income inequality, it is confirmed as the preferred model.
There are mostly negative relationships between the statistically significant controls present in Table 1 and income inequality. In (1A), Covid-19, GDP per capita and education all decrease income inequality. Labour force participation increases income inequality as working people earn more and become richer than those who don’t, exacerbating the gap between these groups. Meanwhile, there is a negative relationship between GDP and income inequality controlling for endogeneity in (1B). The consistent evidence of GDP growth decreasing income inequality implies that higher income countries have lower income inequality (Kuznets, 1955).
Table 1: Results of the DK-FE (1A) and GMM (1B) estimations of the effect of international tourism revenue on income inequality, 2005-2021.
| Variables | DK-FE (1A) |
GMM (1B) |
|---|---|---|
| Lag of income inequality | N/A | 0.119 (0.200) |
| GDP per capita | -1.411** (0.495) |
-3.546** (1.574) |
| Government Effectiveness | -0.722 (0.481) |
-1.201 (1.958) |
| Education | -0.492*** (0.128) |
0.484 (0.413) |
| Labour Force Participation | 9.447** (3.155) |
1.726 (6.843) |
| Unemployment | 0.058 (0.031) |
-0.029 (0.113) |
| Inflation | -0.165 (0.021) |
-0.061 (0.122) |
| Covid-19 | -0.806* (0.362) |
-0.118 (1.307) |
| TR | -0.524 (0.319) |
1.222** (0.506) |
| No. of observations | 952 | 896 |
| No. of countries | 56 | 56 |
Standard errors are shown in parentheses.
*: p < 0.1, **: p < 0.05, ***: p < 0.01
Caption: This table shows that tourism revenue is linked to higher income inequality in the GMM model but not significantly in the fixed effects model. GDP per capita consistently reduces inequality, and other variables show mixed effects.
B. Additional Results: Informal Economy & Development
Results of additional regressions incorporating the role of the informal economy and development of a country in the international tourism-inequality relationship are presented in Table 2. Firstly, results on the international tourism revenue coefficient in the DK-FE & GMM regressions in Table 2 act as a robustness check as they match the respective results in Table 1. The international tourism revenue variable in the DK-FE regression (2A) yields a statistically insignificant result, which could be explained by endogeneity or data availability issues as in the main regression. There is a large positive coefficient of 4.426 on the international tourism revenue variable in (2B), which implies that a 1 percent increase in international tourism revenue increases the Gini coefficient by 0.044. This is significant at the 1 percent level and reflects a sizeable positive impact.
Secondly, the interaction terms between the OECD dummy variable and international tourism revenue and the informal economy share and international tourism revenue in Table 2 provide an extension to this analysis. There is a statistically significant coefficient on the informal economy interaction term for both methodologies of -0.029 in (2A) and -0.070 in (2B). Due to the consistency of this result across methodologies, this conclusively suggests that the international tourism-income inequality relationship is dependent on the informal sector in a country. It also indicates that a higher share of the informal sector in a country leads to the impact of international tourism revenue on income inequality to diminish. As Lv (2020) characterises high and increasing tourism countries as having an increasing informal sector, this result in Table 2 is relevant for such economies. Specifically, it implies that high tourism and informality weakens the positive effect of international tourism revenue found on income inequality. Interestingly, there is a statistically significant positive effect of the informal economy share on income inequality in both models in Table 2, suggesting that an increasing informal economy increases income inequality. This could logically be understood as more people working in lower-paid, informal jobs in economies with a larger informal sector, exacerbating income inequality. Thus, the diminishing effect of the informal economy on the positive tourism-inequality relationship could suggest that the informal economy provides low-income people with some form of employment in the tourism sector, reducing income inequality. Alternatively, it could also be down to more low-income people working informally in tourism sectors not being included in official statistics. Regardless, as international tourism revenue has thus far only evidently reduced income inequality with high levels of informality, the informal sector could play a key role in the tourism sector decreasing income inequality.
The interaction term between the OECD dummy variable and international tourism revenue takes into account the development of a country. There is a negative coefficient on this interaction term, which is statistically significant at the 5 percent level for the GMM estimation in (2B), but not the DK-FE one. This presents some evidence that if a country is developed (ie it is an OECD country), the positive effect of international tourism revenue on income inequality is lower, compared to non-OECD countries that experience a greater positive relationship between international tourism revenue and income inequality. This is logical as income redistribution has declined and income inequality risen in OECD countries, and more unequal OECD countries tend to redistribute more, reducing their inequality (Causa et al., 2019; Ostry et al., 2014). Although this takeaway contradicts Wang and Tziamalis (2023), their sample is limited in developing countries, and this result does support the findings of Chi (2021) that tourism decreases inequality more for developed than developing countries.
As such, this additional analysis has found: the positive effect of international tourism revenue on income inequality using GMM estimation is robust to the inclusion of interaction terms; significant evidence of a reduction in this positive effect of international tourism revenue on income inequality for countries with a higher share of the informal economy; and some evidence of a reduction in this positive relationship for developed countries.
Table 2: Additional results of the DK-FE (2A) and GMM (2B) estimations of the effect of international tourism revenue on income inequality with interaction terms, 2005-2020.
| Variables | DK-FE (2A) |
GMM (2B) |
|---|---|---|
| Lag of income inequality | N/A | 0.046 (0.207) |
| GDP per capita | -0.612 (0.454) |
-2.127 (1.391) |
| Government Effectiveness | -0.383 (0.477) |
-1.108 (2.086) |
| Education | -0.455*** (0.133) |
0.687* (0.371) |
| Labour Force Participation | 9.132** (3.254) |
-1.451 (8.513) |
| Unemployment | 0.085** (0.032) |
0.048 (0.101) |
| Inflation | -0.017 (0.021) |
-0.141 (0.151) |
| Covid-19 | -0.658 (0.362) |
-1.458 (1.171) |
| Informal Economy | 0.385** (0.098) |
0.629** (0.249) |
| TR | 0.351 (0.630) |
4.426*** (1.321) |
| OECD * TR | -0.299 (0.410) |
-0.834** (0.323) |
| Informal Economy * TR | -0.029* (0.015) |
-0.070** (0.030) |
| No. of observations | 880 | 825 |
| No. of countries | 55 | 55 |
Standard errors are shown in parentheses.
*: p < 0.1, **: p < 0.05, ***: p < 0.01
Caption: This table shows that tourism revenue increases income inequality overall (especially in the GMM model), but this effect is weaker in OECD countries and in countries with larger informal economies.
C. Robustness Results
Table 3 contains results for robustness tests that further examine the effect of international tourism revenue on income inequality of a country. As these regressions act as robustness tests, only the coefficients on the international tourism revenue are discussed in detail, although all results can be found in Table 3. Nevertheless, the statistically significant results of controls on income inequality in Table 3 are largely consistent with those seen in Tables 1 and 2; GDP per capita, education and Covid-19 all clearly decrease income inequality; higher labour force participation increases income inequality; with the only exception being that there is additional evidence in Table 3 of the government effectiveness measure decreasing income inequality, which follows economic and political logic of a government with good institutions redistributing income.
(3A-C) and (3D-F) summarise the regressions of international tourism revenue on the palma ratio, decile ratio and quintile ratio of income percentiles of a country as alternative measures of income inequality. Firstly, the coefficients on international tourism revenue for the DK-FE models are all negative (-0.03, -1.18 and -0.46 with significance at 10, 5 and 1 percent levels, respectively). Interestingly, they display the first evidence of a direct negative effect of tourism on income inequality in this study – increasing international tourism revenue leads to a decrease in income inequality in a country. Such a negative relationship between tourism and inequality is plausible and could have been caused by increased employment, growth and redistribution (Njoya and Seetaram, 2018; De Vita and Kyaw, 2017; Carrascal Incera and Fernández, 2015). Although measurement errors could have biased the results in the main DK-FE models in this study, this is not the consistent or convincing finding. Secondly, there is a statistically significant, positive effect of international tourism revenue on income inequality with the palma ratio as the dependent variable in the GMM estimation (1D). Despite statistical insignificance with the decile and quintile ratios as dependent variables, this result does support those in GMM models in Tables 1 and 2. This indicates that the positive relationship between international tourism revenue and income inequality with the preferred methodological approach which controls for endogeneity challenges is somewhat robust.
The omission of outlier countries that may distort the underlying mechanism of increasing international tourism revenue impacting income inequality due to low levels, low growth or a lack of growth of tourism also acts as a robustness test. In (4A), there is also a statistically significant negative effect of international tourism revenue on income inequality consistent with a percentage increase in international tourism revenue decreasing the Gini coefficient albeit not too substantially by 0.0069. This follows the result of the robustness tests in (1A-C) which do vary from the DK-FE results in (1A) and (2A) in Tables 1 and 2. Meanwhile, the statistically significant positive and fairly large coefficient of 1.149 in (4B) further shows that the outcome of a large, positive relationship between tourism and inequality using this method found throughout this paper is consistently evident and robust.
Overall, the main findings from robustness tests show that the GMM results are reasonably robust to a range of checks. Meanwhile, DK-FE results show a negative result, differing from the statistically insignificant DK-FE results and the GMM results throughout.
Table 3: Robustness results of DK-FE and GMM estimations of the effect of international tourism revenue on income inequality.
|
DK-FE |
GMM | |||||||
|---|---|---|---|---|---|---|---|---|
| Variables | (3A) | (3B) | (3C) | (3D) | (3E) | (3F) | DK-FE (4A) |
GMM (4B) |
| Lag of income inequality | N/A | N/A | N/A | 0.072 (0.177) |
0.394** (0.158) |
0.445*** (0.139) |
N/A | 0.025 (0.211) |
| GDP per capita | -0.113*** (0.030) |
-3.684*** (0.747) |
-1.389*** (0.263) |
0.014 (0.072) |
0.955 (1.353) |
0.300 (0.498) |
-1.074* (0.513) |
-4.235** (1.798) |
| Government Effectiveness | -0.081*** (0.196) |
-0.586 (0.598) |
-0.403** (0.152) |
-0.219* (0.121) |
-4.454* (2.443) |
-1.652* (0.884) |
-0.942 (0.545) |
-0.928 (2.137) |
| Education | -0.023*** (0.008) |
-0.880** (0.306) |
-0.327** (0.109) |
0.032** (0.015) |
0.631** (0.273) |
0.264** (0.109) |
-0.448*** (0.116) |
0.326 (0.469) |
| Labour Force Participation | 0.595** (0.200) |
19.402*** (5.620) |
6.994** (2.295) |
0.103 (0.317) |
5.111 (5.195) |
1.287 (2.004) |
8.435** (3.266) |
-2.751 (9.438) |
| Unemployment | 0.001 (0.002) |
0.062 (0.052) |
0.032 (0.020) |
-0.001 (0.004) |
-0.002 (0.087) |
0.004 (0.031) |
0.061* (0.032) |
-0.059 (0.117) |
| Inflation | 0.000 (0.000) |
-0.022 (0.020) |
-0.006 (0.008) |
-0.004 (0.006) |
-0.170 (0.135) |
-0.051 (0.050) |
-0.042 (0.027) |
0.071 (0.106) |
| Covid-19 | -0.025 (0.014) |
-2.505*** (0.384) |
-0.846*** (0.130) |
-1.131 (0.083) |
-6.993*** (2.383) |
-1.960*** (0.680) |
-0.899* (0.405) |
0.865 (1.446) |
| TR | -0.031* (0.016) |
-1.184** (0.425) |
-0.463*** (0.140) |
0.031** (0.015) |
0.181 (0.336) |
0.123 (0.114) |
-0.693* (0.372) |
1.149** (0.545) |
| No. of observations | 690 | 690 | 690 | 644 | 644 | 644 | 833 | 784 |
| No. of countries | 46 | 46 | 46 | 46 | 46 | 46 | 49 | 49 |
Standard errors are shown in parentheses.
*: p < 0.1, **: p < 0.05, ***: p < 0.01
Caption: This table presents robustness checks showing that the effect of tourism revenue on income inequality varies by model and specification: it is negative and significant in some DK-FE models, but positive and significant in GMM models.
V. Conclusion
This paper has investigated the impact of increasing international tourism revenue on income inequality within countries for a sample of developed and developing countries from 2005-2021, in order to clarify previous mixed findings in the literature. The approach that this paper takes to empirically estimate this relationship is twofold: taking into account heterogeneity and cross-sectional dependence using a fixed-effects regression with Driscoll-Kraay standard errors; and reducing endogeneity concerns to strengthen causality using a system-GMM estimation.
The main finding of this paper is a positive effect of increasing international tourism revenue on income inequality for a sample of developed and developing countries from 2005-2021. As such, this paper has found that increasing international tourism revenue increases income inequality within a country.
The conclusions of this paper are, firstly, that the most convincing result that is consistent and robust throughout is that increases in international tourism revenue substantially increase income inequality when endogeneity concerns are reduced and stronger causality is established. Secondly, the relationship between international tourism revenue and income inequality is also conclusively dependent on the share of the informal economy of a country and dependent on its level of development such that: the larger the share of the informal sector, the less international tourism revenue increases income inequality; and the positive effect of international tourism revenue on income inequality is lower for OECD countries than non-OECD countries.
The primary contribution of this paper is that an up-to-date empirical assessment of the impact of international tourism revenue on income inequality has been provided using the most recent data available. This paper has also contributed to the literature in that it has extended research on this relationship by examining it with consideration for the share of the informal economy in a country, which had not been researched prior, despite the importance and relevance of the role of the informal economy in the effect of tourism on inequality of countries.
Limitations of this study include a lack of consistent statistically significant evidence of an effect of international tourism revenue on income inequality using the DK-FE methodology, despite a range of controls used. Also, the nature of the dependent variable of income inequality meant that it would have been difficult to find an exclusive instrument for this study, meaning not every variable that could bias this estimation has been accounted for and endogeneity concerns have only been reduced to an extent using the GMM estimation. Although the main GMM results are fairly robust to a range of robustness checks, there are also a few exceptions. Finally, data availability means that the sample of countries used is somewhat regionally limited.
There are some important implications for policies related to tourism and inequality raised by this paper. Increasing tourism exacerbating income inequality found in this study certainly show that there are insufficient grounds to suggest that tourism decreases income inequality apart from in instances with a substantial informal economy. This means tourism policies that aim to use increasing inbound international tourism revenue into countries in order to decrease income inequality in any formal manner are currently failing to do so. Therefore, sustainable and social tourism policies should focus on utilising international tourism revenue, in particular studying its interplay with the informal economy, to aim to decrease income inequality in a country going forward.
Future research into this field could increase the number of countries in the panel from regions not included in this paper such as Africa to obtain a broader, more reliable analysis. Further investigation into the role of the informal sector on tourism and inequality could deploy data on specifically informal employment (expanding from just a measure of the informal economy) due to the relevance of employment in the context of the informal tourism sector. Additional analysis of this channel could be carried out by the tourism type or income level of a country. Finally, the effect of the Covid-19 pandemic on the international tourism-income inequality relationship could specifically be researched when more data becomes available to update this field further, as this paper has begun to do by updating the findings in this field up to and including 2021.
VI. References
Alam, M.S. and Paramati, S.R. (2016). The impact of tourism on income inequality in developing economies: Does Kuznets curve hypothesis exist? Annals of Tourism Research, 61, 111–126.
Arellano, M. and Bond, S. (1991). Some tests of specification for panel data: Monte Carlo evidence and an application to employment equations. The Review of Economic Studies, 58(2), 277–297.
Balaguer, J. and Cantavella-Jorda, M. (2002). Tourism as a long-run economic growth factor: the Spanish case. Applied economics, 34(7), 877–884.
Baum, T. and Hagen, L. (1999). Responses to seasonality: the experiences of peripheral destinations. International Journal of Tourism Research, 1(5), 299–312.
Blundell, R. and Bond, S. (1998). Initial conditions and moment restrictions in dynamic panel data models. Journal of Econometrics, 87(1), 115–143.
Brida, J.G., Cortes-Jimenez, I., and Pulina, M. (2016). Has the tourism-led growth hypothesis been validated? A literature review. Current Issues in Tourism, 19(5), 394–430.
Carrascal Incera, A. and Fernández, M.F. (2015). Tourism and income distribution: Evidence from a developed regional economy. Tourism Management, 47, 11–20.
Causa, O., Browne, J., and Vindics, A. (2019). Income redistribution across OECD countries: Main findings and policy implications. OECD Economic Policy Paper 23, OECD, Paris. https://doi.org/10.1787/2226583X.
Chi, J. (2021). Revisiting the tourism-inequality nexus: evidence from a panel of developed and developing economies. Current Issues in Tourism, 24(6), 755–767.
Cole, S. and Morgan, N. (2010). Tourism and Inequality: Problems and Prospects. CAB International, Oxford.
Croes, R. (2014). The Role of Tourism in Poverty Reduction: An Empirical Assessment. Tourism Economics, 20(2), 207–226.
De Vita, G. and Kyaw, K.S. (2017). Tourism specialization, absorptive capacity, and economic growth. Journal of Travel Research, 56(4), 423–435.
Driscoll, J.C. and Kraay, A.C. (1998). Consistent covariance matrix estimation with spatially dependent panel data. Review of Economics and Statistics, 80(4), 549–560.
Elgin, C., Kose, M.A., Ohnsorge, F., and Yu, S. (2021). Understanding Informality. CERP Discussion Paper 16497, Centre for Economic Policy Research, London.
Fernández-Morales, A., Cisneros-Martínez, J.D., and McCabe, S. (2016). Seasonal concentration of tourism demand: Decomposition analysis and marketing implications. Tourism Management, 56, 172–190.
Godin, Y. (2017). Tourism in actions: 20 examples of social policies & programmes around the world. ISTO.
Gooroochurn, N. and Milner, C. (2005). Assessing indirect tax reform in a tourism-dependent developing country. World Development, 33(7), 1183– 1200.
Herre, B., Samborska, V., and Roser, M. (2023). Tourism. Our World in Data. Kinyondo, A. and Pelizzo, R. (2015). Tourism, development and inequality: The case of Tanzania. Poverty & Public Policy, 7(1), 64–79.
Kuznets, S. (1955). Economic Growth and Income Inequality. The American Economic Review, 45(1), 1–28.
Li, H., Chen, J.L., Li, G., and Goh, C. (2016). Tourism and regional income inequality: Evidence from China. Annals of Tourism Research, 58, 81–99.
Lv, Z. (2019). Deepening or lessening? The effects of tourism on regional inequality. Tourism Management, 72, 23–26.
Lv, Z. (2020). Does tourism affect the informal sector? Annals of Tourism Research, 80.
Mahadevan, R. and Suardi, S. (2019). Panel evidence on the impact of tourism growth on poverty, poverty gap and income inequality. Current Issues in Tourism, 22(3), 253–264.
Nguyen, C.P., Schnickus, C., Su, relax T.D., and Hong, F.H.L. (2021). The Influence of Tourism on Income Inequality. Journal of Travel Research, 60(7), 1426–1444.
Njoya, E.T. and Seetaram, N. (2018). Tourism contribution to poverty alleviation in Kenya: A dynamic computable general equilibrium analysis. Journal of Travel Research, 57(4), 513–524.
OECD (2017). Policy Statement – Tourism Policies for Sustainable and Inclusive Growth. OECD.
OECD (2023). Income Distribution Database. OECD.
Ostry, J.D., Berg, A., and Tsangarides, C.G. (2014). Redistribution, Inequality, and Growth. IMF Staff Discussion Note, IMF. https://www.imf.org/external/pubs/ft/sdn/2014/sdn1402.pdf.
Oviedo-García, M.A., González-Rodríguez, M.R., and Vega-Vázquez, M. (2019). Does sun-and-sea all-inclusive tourism contribute to poverty alleviation and/or income inequality reduction? The case of the Dominican Republic. Journal of Travel Research, 58(6), 995–1013.
Paramati, S.R., Alam, M.S., and Chen, C-F. (2017). The Effects of Tourism on Economic Growth and CO2 Emissions: A Comparison between Developed and Developing Economies. Journal of Travel Research, 56(6), 712–724.
Pesaran, M.H. (2004). General Diagnostic Tests for Cross Section Dependence in Panels. Working Paper 0435, University of Cambridge, Faculty of Economics.
Raza, S.A. and Shah, N. (2017). Tourism growth and income inequality: does Kuznets Curve hypothesis exist in top tourist arrival countries. Asia Pacific Journal of Tourism Research, 22(8), 874–884.
Roodman, D. (2009). How to do xtabond2: An introduction to difference and system GMM in Stata. The Stata Journal, 9(1), 86–135.
Solt, F. (2020). Measuring Income Inequality Across Countries and Over Time: The Standardized World Income Inequality Database. Social Science Quarterly, 101(3), 1183–1199. SWIID Version 9.5.
South African Government (2023). Tourism. https://www.gov.za/about-sa/tourism.
Tosun, C., Timothy, D., and Öztürk, Y. (2003). Tourism Growth, National Development and Regional Inequality in Turkey. Journal of Sustainable Tourism, 11(2-3), 133–161.
UN Tourism (2023). Tourism Statistics Database. United Nations.
Uzar, U. and Eyuboglu, K. (2019). Can tourism be a key sector in reducing income inequality? An empirical investigation for Turkey. Asia Pacific Journal of Tourism Research, 24(8), 822–838.
Wang, Y. and Tziamalis, A. (2023). International tourism and income inequality: The role of economic and financial development. Tourism Economics, 29(7), 1836–1864.
World Bank (2024). World Development Indicators. World Bank.
World Travel and Tourism Council (2021). Global Economic Impact & Trends 2021. World Travel and Tourism Council.
Appendices
Appendix A
Table A: Country List
| OECD countries (22) | Austria, Belgium, Canada, Czech Republic, Denmark, Finland, France, Germany, Greece, Hungary, Ireland, Luxembourg, Netherlands, Norway, Poland, Portugal, Slovakia, Spain, Sweden, Turkey, United Kingdom, United States |
|---|---|
| Non-OECD countries (34) | Argentina, Armenia, Belarus, Bolivia, Brazil, Bulgaria, Colombia, Costa Rica, Croatia, Cyprus, Dominican Republic, Ecuador, El Salvador, Estonia, Georgia, Hong Kong, Indonesia, Kazakhstan, Kyrgyzstan, Latvia, Lithuania, Malta, Moldova, Panama, Paraguay, Peru, Philippines, Romania, Russia, Singapore, Slovenia, Thailand, Uruguay, Vietnam |
Caption: This table lists the 56 countries included in the analysis, divided into 22 OECD countries and 34 non-OECD countries.
Appendix B
Table B: Variables and Definitions
| Variable | Definition | Source |
|---|---|---|
| Income inequality (GINI) | Gini coefficient of disposable (post-tax) income inequality of a country | Standardized World Income Inequality Database (SWIID) (Solt, 2020) |
| GDP | GDP per capita, measured in USD | World Bank World Development Indicators (WDIs) |
| Government Effectiveness | Aggregate estimate of a country’s quality of public services, civil service, independence from political pressure, quality of policymaking and credibility of government’s commitment to policies | World Bank WDIs |
| Education | Expected level of education in terms of compulsory years of schooling | World Bank WDIs |
| Labour Force Participation | Proportion of population aged 15-64 economically active | World Bank WDIs |
| Unemployment | Proportion of labour force (see above) without, but available for and seeking, employment | World Bank WDIs |
| Inflation | Percentage change in cost to the average consumer of acquiring a basket of goods and services | World Bank WDIs |
| Covid-19 | Dummy variable equal to 1 if year is 2020 or 2021, 0 otherwise | Year |
| Palma Ratio | Ratio of the income of the richest 10 percent to the income of the poorest 40 percent | World Bank WDIs & OECD Income Percentile Database |
| Decile Ratio | Ratio of the income of the richest 10 percent to the income of the poorest 10 percent | World Bank WDIs & OECD Income Percentile Database |
| Quintile Ratio | Ratio of the income of the richest 20 percent to the income of the poorest 20 percent | World Bank WDIs & OECD Income Percentile Database |
| Informal Economy Share | Dynamic general equilibrium (DGE) model-based estimate of informal output (as a percent of official GDP) | World Bank Informal Economy Database |
| OECD | Dummy variable equal to 1 if OECD country, 0 if non-OECD | Country |
| International Tourism Revenue | Inbound tourism expenditure by international tourists within a country (balance of payments travel receipts data), international tourism revenue of country from international sources, measured in USD millions | UN Tourism |
Caption: This table defines all variables used in the analysis and their source.
Appendix C
Bresuch-Pagan / Cook-Weisberg test for heteroskedasticity:
H0: constant variance
Variables: fitted values of GINI
chi2(1) = 10.31
Prob > chi2 = 0.0013
Appendix D
Pesaran (2004) CD Test:
Pesaran’s test of cross sectional independence = 7.438, Pr = 0.0000
Appendix E
Table E: Summary Statistics
| Variable | Observations | Mean | Std. Dev. | Min. | Max. |
|---|---|---|---|---|---|
| GINI | 952 | 34.668 | 7.404 | 22.1 | 53.2 |
| GDP | 952 | 9.543 | 1.121 | 6.167 | 11.803 |
| Government Effectiveness | 952 | 0.610 | 0.884 | -1.210 | 2.470 |
| Education | 952 | 10.586 | 1.877 | 6 | 15 |
| Labour Force Participation | 952 | 4.261 | 0.097 | 3.820 | 4.418 |
| Unemployment | 952 | 7.204 | 4.038 | 0.25 | 27.47 |
| Inflation | 952 | 3.907 | 5.237 | -4.478 | 59.220 |
| Covid-19 | 952 | 0.118 | 0.322 | 0 | 1 |
| Palma Ratio | 690 | 0.959 | 0.285 | 0.559 | 2.023 |
| Decile Ratio | 690 | 12.238 | 8.176 | 3.1 | 72.667 |
| Quintile Ratio | 690 | 6.798 | 3.348 | 3.333 | 26.130 |
| Informal Economy Share | 880 | 27.210 | 12.769 | 7.953 | 65.939 |
| International Tourism Revenue | 952 | 8.333 | 1.483 | 4.290 | 12.10 |
| Informal Economy * International Tourism Revenue | 880 | 215.860 | 87.303 | 76.572 | 501.915 |
| OECD * International Tourism Revenue | 952 | 3.707 | 4.659 | 0 | 12.210 |
Caption: This table presents summary statistics for all key variables, including means and standard deviations.
Appendix F
Table F: Detailed descriptive statistics of the natural logarithm of international tourism revenue
| Percentiles | Value | Smallest |
|---|---|---|
| 1% | 5.075 | 4.290 |
| 5% | 5.894 | 4.357 |
| 10% | 6.387 | 4.431 |
| 25% | 7.302 | 4.522 |
| 50% | 8.384 | N/A |
| Percentiles | Value | Largest |
|---|---|---|
| 75% | 9.306 | 12.170 |
| 90% | 10.331 | 12.188 |
| 95% | 10.900 | 12.201 |
| 99% | 11.778 | 12.210 |
| Obs | 952 |
|---|---|
| Mean | 8.333 |
| Std. Dev. | 1.482 |
| Variance | 2.200 |
| Skewness | -0.015 |
| Kurtosis | 2.732 |
Caption: This table shows detailed descriptive statistics for the natural log of international tourism revenue, with 952 observations. The mean is 8.33, values range from 4.29 to 12.21, and the distribution is approximately symmetric (skewness ≈ 0) with moderate kurtosis.
Appendix G
Table G: Average growth rate of international tourism revenue (before natural logarithmic transformation) for 56 sample countries, 2005-2019
| Start Value (2005) | Pre-Covid End Value (2019) | Growth Rate | |
|---|---|---|---|
| Average | 8,239.14 million USD | 16,254.50 million USD | 97.28% |
Caption: This table shows that, on average, international tourism revenue nearly doubled across 56 countries between 2005 and 2019
Appendix H
Model F-tests for DK-FE and GMM models:
DK-FE:
Model F-test: Equal FMI
F(8, 5.5) = 22.43
Prob > F = 0.0010
GMM:
Model F-test: Equal FMI
F(9, 52.2) = 7.76
Prob > F = 0.0000