Volume 34, Issue 1: Paper 2
The Effects of Hospital Desegregation on Black and Nonwhite Infant and Maternal Outcomes in the American South
I. Literature Review
In the past 50 years, the rate of infant and maternal mortality has steadily decreased across all ethnic groups in the United States (Singh and Yu, 2019). This statistic suggests that modern medicine and technology improvements have led to better healthcare outcomes for mothers and infants. However, not all ethnic groups across America have benefited equally from these improvements. Despite the overall decrease in maternal and infant mortality rates, a black infant is twice as likely to die during birth as a white infant (Singh and Yu, 2019). This disparity has gotten increasingly worse; the mortality rate of black infants was 60% higher than that of white infants in 1850 and rose to 240% higher than that of white infants in 2023 (Owens et al., 2019; U.S. Department of Health and Human Services). These large and increasing gaps between the outcomes of black and white mothers and infants suggests that there is some underlying factor that results in differing outcomes between black patients and white patients. It is possible that the unequal distribution of medical technology and funding across America is responsible for the increasing gap in black-white infant and maternal mortality rates. My research aims to determine whether resource and funding distribution affects black and nonwhite infant and maternal mortality rates using hospital desegregation in the American South as an instrument for resource redistribution.
In the pre-1960’s American South, segregation of the hospital system was commonplace and extensive. Jim Crow laws were responsible for the development of two hospital systems, one to serve black people, and one to serve white people. Additionally, black medical students and residents could only be trained at the segregated hospitals, where they received lower quality training compared to their white peers who were trained at white hospitals. This ensured that black patients would receive lower quality compared to white patients (Smith, 2005). In the North, however, approximately 82% of hospitals were desegregated, suggesting that black patients received higher-quality care (Cornely, 1959).
In 1964, the desegregation of southern hospitals began with the implementation of Title VI of the Civil Rights Act. Title VI required that hospitals desegregate to continue to receive Medicare funds (Smith, 2005). The desegregation of predominantly southern hospitals allowed black mothers to have access to the high-quality equipment and doctors that were formerly only available at white hospitals. To investigate whether hospital funding and resource allocation can have an impact on maternal and infant outcomes, I will compare maternal and infant mortality rates between northern and southern hospitals before and after desegregation measures were implemented. I will also examine how the desegregation of hospitals in the South impacted both black and white mothers’ preferences on birthing location.
To conduct my analysis of the effect of hospital desegregation on black infant and maternal mortality rates and birth location in the South, I will run several differences-in-differences regressions. These regressions will allow me to compare the change in mortalities or preferences in the South to the North before and after Medicare implementation and the required hospital desegregation that came with it. I will repeat these regressions using data on white mortalities and preferences to determine whether white mothers and infants were also impacted by the desegregation of hospitals.
The results of this study indicate that black infant and nonwhite maternal mortalities in the South decreased by more than those in the North. White infant and maternal mortalities did not differ as much in the North and South as black and nonwhite did. Additionally, the introduction of Medicare is associated with a greater increase in the number of nonwhite births to a physician in a hospital in the South than in the North. These results suggest that access to resources through the desegregation of hospitals had a role in improving black and nonwhite outcomes.
II. Background
A. The Link Between Medicare and Hospital Desegregation
President Lyndon B. Johnson signed Medicare into law on July 30, 1965, as a way to reduce healthcare costs for patients and improve care for elderly Americans (“Medicare and Medicaid Act (1965)” 2021). The financial benefits provided by Medicare were nearly impossible for hospitals to turn down, but they had to comply with the Title VI of the Civil Rights Act of 1964 to enroll. Title VI prohibited the discrimination of patients or staff in medical facilities or hospitals. This initiative ensured that only hospitals that had desegregated could benefit from Medicare funding (Burrows and Berney 2019).
The process of desegregating southern hospitals went surprisingly smoothly compared to the protests and riots that surrounded the desegregation of other institutions such as schools. This is largely due to the financial benefit that Medicare provided to hospital in exchange for desegregating (Burrows and Berney 2019). By July of 1966, one year after Medicare was signed into law, over 95% of hospitals in the nation were enrolled (Smith 2005). The high level of enrollment was seen in both the North and the South, with states such as Georgia and Alabama reaching 80 to 90% enrollment despite previous pushbacks against Federal desegregation orders (Pohl 2000).
B. Hospital Desegregation and Black Maternal and Infant Mortality Rates
The black-white infant mortality ratio is a common indicator of disparities between black and white populations. The ratio remained relatively constant from the 1940’s to the 1960’s before decreasing from 1.90 to 1.65 between 1965 and 1971. The research of Chay and Greenstone (2000) attribute this drop to the desegregation of southern hospitals based on an analysis of black and white infant mortality outcomes in various regions throughout the United States. They also note an increase in the percentage of black births that take place in a hospital after 1965 which likely contributed to the decreased mortality ratio.
In 2006, Almond et al. released a study examining the effects of hospital desegregation in Mississippi on the black-white infant mortality gap. Their research found that the implementation of Medicare resulted in a decrease in black infant mortality and a decrease in the black-white infant mortality gap. They also looked at trends in the black-white infant mortality gap in the nation as a whole and concluded that the desegregation of Southern hospitals was largely responsible for the narrowing of the national black-white infant mortality ratio.
Anderson et al. released research that contradicted that of Almond et al. in 2021. Their research examined the effect of hospital desegregation on black and white infant mortality and birth location in five southern states. Anderson et al. found no evidence that hospital desegregation affected black or white infant mortality rates, and that desegregation was not responsible for the increasing trend of mothers giving birth in hospitals. This result contradicts much of the previous research of Chay and Greenstone (2000) and Almond et al. (2006).
All three studies utilize event study regression models and pull data from the same database of birth and death records by state and region. Anderson et al. (2021) attribute the conflicting results to the small sample size when looking at specific states and regions and the lack of year and county-level fixed effects in the Almond et al. (2006) analysis of Medicare implementation by Mississippi county over three years. The three studies also look only at black outcomes or compare black outcomes to white outcomes and focus on only specific regions.
In my research, I will compare black outcomes in the South to black outcomes in the North which will allow me to compare the effect of Medicare in highly segregated areas versus less-segregated areas. This approach will also allow me to include year and state-level fixed effects in my analyses. Additionally, I will examine maternal mortality rates and birth location distribution in addition to infant mortality. This will allow me to obtain a full picture of the effects of hospital desegregation in the South.
III. Data
The data in this study was obtained from the Center for Disease Control’s Vital Statistics of the United States. The data consists of births, maternal deaths, and infant deaths using birth and death certificates. Infant and maternal mortality rates and birthing location distribution were obtained from this data set. For the purposes of this study, I made several modifications to the data. I dropped the data for states that were not involved in the Civil War as confederate, union, or border states. These states were excluded to define northern and southern states based on side in the Civil War. The Confederate states include Texas, Arkansas, Tennessee, Florida, North Carolina, South Carolina, Virginia, Mississippi, Alabama, Georgia, and Louisiana and make up the South. The Union states include Maine, New York, New Hampshire, Vermont, Massachusetts, Connecticut, Rhode Island, Pennsylvania, New Jersey, Ohio, Indiana, Illinois, Kansas, Michigan, Wisconsin, Minnesota, Iowa, California, Nevada, and Oregon and make up the North. The border states are Kentucky, West Virginia, Missouri, Maryland, and Delaware and are included in the South for the robustness check regressions (U.S. National Parks Service). Additionally, I dropped observations where there were missing values for mortality counts, mortality rates, and birth location. In addition to the data obtained from the Vital Statistics, I used resources from the Kaiser Commission on Medicaid and the Uninsured to determine the month and year that each state of interest adopted Medicaid. While Medicaid did not require hospitals to desegregate, it granted many previously uninsured people insurance and may have had an effect on patient outcomes in the years being studied.
The infant mortality data is categorized into mortality counts that occurred within 28 days of birth and within one year of birth from 1955 to 1975. The data is categorized by state, race (Negro, white, or other), and year. The maternal mortality data includes maternal deaths per 1000 births from 1960 to 1979. It is categorized by state, race (white or nonwhite), and year. The data on birth location includes the percentage of births that took place with a physician in a hospital, with a physician not in a hospital, with a midwife, and other from 1960 to 1980. The percentages are categorized by state, race (white or nonwhite), and year. The data has been summarized in Table 1 below.
Table 1: Data Summary
Union States
| Mean | SD | Min | Max | Obs | |
|---|---|---|---|---|---|
| Year-State Frequency of Black Infant Mortality Under One Year | 425.85 | 527.41 | 1 | 2276 | 399 |
| Year-State Frequency of White Infant Mortality Under One Year | 1919.94 | 1819.96 | 89 | 7612 | 418 |
| Year-State Frequency of Black Infant Mortality Under 28 Days | 310.75 | 380.63 | 1 | 1687 | 393 |
| Year-State Frequency of White Infant Mortality Under 28 Days | 1461.26 | 1381.11 | 68 | 5647 | 418 |
| Nonwhite Maternal Mortality Rate per 1000 Births | 63.35 | 86.86 | 6.30 | 952.4 | 281 |
| White Maternal Mortality Rate per 1000 Births | 14.62 | 7.74 | 2.10 | 53.00 | 370 |
| Percent of Nonwhite Births to a Physician in Hospital | 95.30 | 19.11 | 0 | 100 | 414 |
| Percent of White Births to a Physician in Hospital | 94.72 | 21.21 | 0 | 100 | 418 |
| Percent of Nonwhite Births to a Physician not in Hospital | 6.02 | 22.47 | 0 | 100 | 365 |
| Percent of White Births to a Physician not in Hospital | 0.29 | 0.24 | 0 | 1.6 | 418 |
| Percent of Nonwhite Births to a Midwife | 0.13 | 0.29 | 0 | 2.1 | 202 |
| Percent of White Births to a Midwife | 5.96 | 23.50 | 0 | 99.7 | 335 |
Confederate States
| Mean | SD | Min | Max | Obs | |
|---|---|---|---|---|---|
| Year-State Frequency of Black Infant Mortality Under One Year | 1033.34 | 431.27 | 164 | 1786 | 231 |
| Year-State Frequency of White Infant Mortality Under One Year | 1390.45 | 1098.53 | 354 | 5833 | 231 |
| Year-State Frequency of Black Infant Mortality Under 28 Days | 624.10 | 244.56 | 116 | 1142 | 231 |
| Year-State Frequency of White Infant Mortality Under 28 Days | 1038.43 | 773.98 | 260 | 3998 | 231 |
| Nonwhite Maternal Mortality Rate per 1000 Births | 71.10 | 35.72 | 14.40 | 155.30 | 209 |
| White Maternal Mortality Rate per 1000 Births | 18.36 | 8.43 | 2.50 | 41.70 | 208 |
| Percent of Nonwhite Births to a Physician in Hospital | 83.63 | 22.96 | 0 | 99.7 | 231 |
| Percent of White Births to a Physician in Hospital | 94.37 | 21.12 | 0.10 | 100 | 231 |
| Percent of Nonwhite Births to a Physician not in Hospital | 6.49 | 20.83 | 0.10 | 99.7 | 231 |
| Percent of White Births to a Physician not in Hospital | 0.37 | 0.54 | 0 | 5.7 | 231 |
| Percent of Nonwhite Births to a Midwife | 8.99 | 10.67 | 0 | 44.5 | 231 |
| Percent of White Births to a Midwife | 5.11 | 21.06 | 0 | 99.7 | 231 |
Border States
| Mean | SD | Min | Max | Obs | |
|---|---|---|---|---|---|
| Year-State Frequency of Black Infant Mortality Under One Year | 327.30 | 230.70 | 29 | 827 | 84 |
| Year-State Frequency of White Infant Mortality Under One Year | 1164.40 | 426.95 | 482 | 1957 | 84 |
| Year-State Frequency of Black Infant Mortality Under 28 Days | 223.92 | 158.92 | 24 | 551 | 84 |
| Year-State Frequency of White Infant Mortality Under 28 Days | 865.14 | 311.08 | 359 | 1464 | 84 |
| Nonwhite Maternal Mortality Rate per 1000 Births | 63.03 | 33.97 | 8.40 | 165.80 | 72 |
| White Maternal Mortality Rate per 1000 Births | 18.91 | 10.58 | 3.70 | 44.10 | 76 |
| Percent of Nonwhite Births to a Physician in Hospital | 92.92 | 21.03 | 0 | 100 | 84 |
| Percent of White Births to a Physician in Hospital | 94.33 | 21.18 | 0 | 99.9 | 84 |
| Percent of Nonwhite Births to a Physician not in Hospital | 6.17 | 21.58 | 0.10 | 99.50 | 80 |
| Percent of White Births to a Physician not in Hospital | 0.52 | 0.55 | 0 | 2.6 | 84 |
| Percent of Nonwhite Births to a Midwife | 1.14 | 1.16 | 0 | 4.1 | 74 |
| Percent of White Births to a Midwife | 5.16 | 21.49 | 0 | 99.5 | 82 |
Overall
| Mean | SD | Min | Max | Obs | |
|---|---|---|---|---|---|
| Year-State Frequency of Black Infant Mortality Under One Year | 610.80 | 554.90 | 1 | 2276 | 714 |
| Year-State Frequency of White Infant Mortality Under One Year | 1666.49 | 1541.56 | 89 | 7612 | 733 |
| Year-State Frequency of Black Infant Mortality Under 28 Days | 402.68 | 356.74 | 1 | 1687 | 708 |
| Year-State Frequency of White Infant Mortality Under 28 Days | 1259.70 | 115860 | 68 | 5647 | 733 |
| Nonwhite Maternal Mortality Rate per 1000 Births | 66.19 | 66.33 | 6.3 | 952.4 | 562 |
| White Maternal Mortality Rate per 1000 Births | 16.31 | 8.55 | 2.1 | 53.0 | 654 |
| Percent of Nonwhite Births to a Physician in Hospital | 91.33 | 21.26 | 0 | 100 | 729 |
| Percent of White Births to a Physician in Hospital | 94.57 | 21.15 | 0 | 100 | 733 |
| Percent of Nonwhite Births to a Physician not in Hospital | 6.20 | 21.79 | 0 | 100 | 676 |
| Percent of White Births to a Physician not in Hospital | 0.34 | 0.41 | 0 | 5.7 | 733 |
| Percent of Nonwhite Births to a Midwife | 4.32 | 8.39 | 0 | 44.5 | 507 |
| Percent of White Births to a Midwife | 5.55 | 22.38 | 0 | 99.7 | 648 |
IV. Empirical Model
A. Overview
To estimate the causal effects of hospital desegregation in the South on infant and maternal mortality and maternal birthing preferences, this study uses a Differences-in-Differences (DiD) design. A DiD regression can compare the change in infant mortality in southern states before and after desegregation to that of northern states. This model allows me to control for any time-related variables such as improvements in medical care that may have an independent effect on infant mortality rates.
One state-independent event that may have impacted infant and maternal mortality rates and birth location is the implementation of Medicaid. Starting in 1965, states had the option in enroll in Medicaid which provided health insurance to low-income families (Medicaid.gov). A dummy variable controlling for Medicaid implementation with the state in the indexed year will be included in the regressions to account for this.
While Medicare enrollment began in July of 1965, many southern states were reluctant to desegregate and thus enrolled in Medicare years after it was enacted. The official records of when each hospital enrolled in Medicare were purged due to the federal record retention schedule (Smith 2005). Because of the uncertainty surrounding the exact year in which southern hospitals desegregated, each regression will be run twice with one assuming a 1966 adoption and one assuming 1967. These regressions will allow me to compare the effects of allowing another year for hospitals to desegregate.
B. Infant Mortality Model
For the analysis of infant mortality, the data is given in counts not rates. Thus, for these regressions the natural log of infant mortality counts will be used as the dependent variable to control for differences in state population. I have data on the total number of infant deaths for children less than one year old and less than 28 days old. A regression will be run for each outcome. Additionally, a regression will be run separately for black infants and for white infants for the two outcomes to observe whether changes in infant mortality were restricted to black infants or if both races were impacted.
The estimating equation focusing on effects on infant mortality is given below:
(1)$$ln(IM)_{(S,T)}=β_0+β_1 (SOUTH * POST MEDICARE)_{(S,T)}+β_2POST MEDICARE_T+ϕ_S+β_3MEDICAID_{(S,T)}+ε_{(S,T)}$$
Where IM is the black or white infant mortality count under one year or under 28 days in state S and year T. The natural log of mortality is taken because the data is given in counts, not rates. SOUTHS,T*POST MEDICARES,T is the variable of interest, and β1 measures the difference in infant mortality before and after Medicare implementation in Confederate versus Union states. POST MEDICARET is a dummy variable that equals 0 if the year T is before 1966 and equals 1 if the year T is 1966 or after Medicare was implemented. MEDICAIDS,T is a dummy variable that equals 0 if state S has not implemented Medicaid in year T and equals 1 if the state has. ϕS represents state fixed effects, and εS,T is the error term.
C. Maternal Mortality Model
The data regarding maternal mortality is given in maternal deaths per 1000 births. A regression will be run analyzing the effect of desegregation on nonwhite and white maternal mortality rates in the South versus in the North.
The estimating equation focusing on effects on maternal mortality is given below:
(2) $$MMR_{(S,T)}=β_0+β_1(SOUTH*POST MEDICARE)_{(S,T)}+β_2POST MEDICARE_T+ϕ_S+β_3MEDICAID_{(S,T)}+ε_{(S,T)}$$
Where MMRS,T the black or white maternal mortality rate in state S and year T. SouthS,T*Post MedicareS,T is the variable of interest, and β1 measures the difference in maternal mortality rates before and after Medicare implementation in Confederate versus Union states. Other right-hand side variables are measured similarly to those in equation 1.
D. Birth Location Model
The data on birth location tracks the percentage of births that were assisted by a physician in a hospital, a physician not in a hospital, a midwife, and other. A regression analyzing the change in nonwhite birth location will be run using the previous three location variables as outcome. The same regressions will be run for white birth location. Each will compare changes in southern preferences to changes in northern preferences.
The estimating equation focusing on effects on birth location is given below:
(3) $$MP_{(S,T)}=β_0+β_1(SOUTH*POST MEDICARE)_{(S,T)}+β_2POST MEDICARE_T+ϕ_S+β_3MEDICAID_{(S,T)}+ε_{(S,T)}$$
Where MPS,T represents the percentage of nonwhite or white mothers who gave birth to a physician in a hospital, a physician not in a hospital, or a midwife depending on the regression. SOUTHS,T*POST MEDICARES,T is the variable of interest, and β1 measures the difference in birth location before and after Medicare implementation in Confederate versus Union states. Other right hand side variables are measured similarly to those in equation 1.
V. Results
A. Infant Mortality
I first plotted infant mortality counts before 28 days and before one year between Confederate and Union states to assess for parallel trends. In these graphs, the treatment occurs during 1966, although regressions were also run with a treatment year of 1967 to ensure all southern hospitals had desegregated. The purpose of the parallel trends graphs is to judge whether the pre-trends are parallel between the treated and untreated group. Parallel trends are one of the necessary assumptions for generating unbiased estimates using a DiD regression.
Figure 1: Black Infant Mortality Under One Year
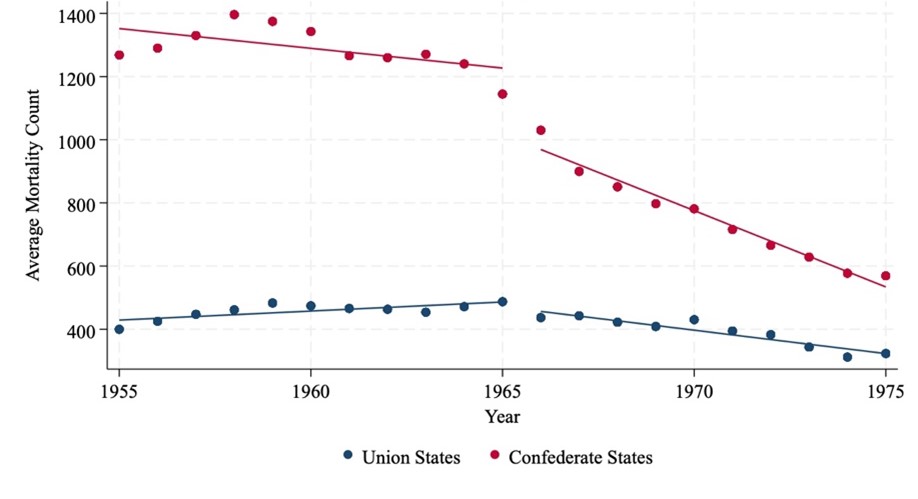
Figure 1 shows Black infant mortality (under one year) from 1955 to 1975. Rates were higher in Confederate states than Union states, but after 1965, mortality declined sharply in Confederate states, narrowing the gap
Figure 2: Black Infant Mortality Under 28 Days
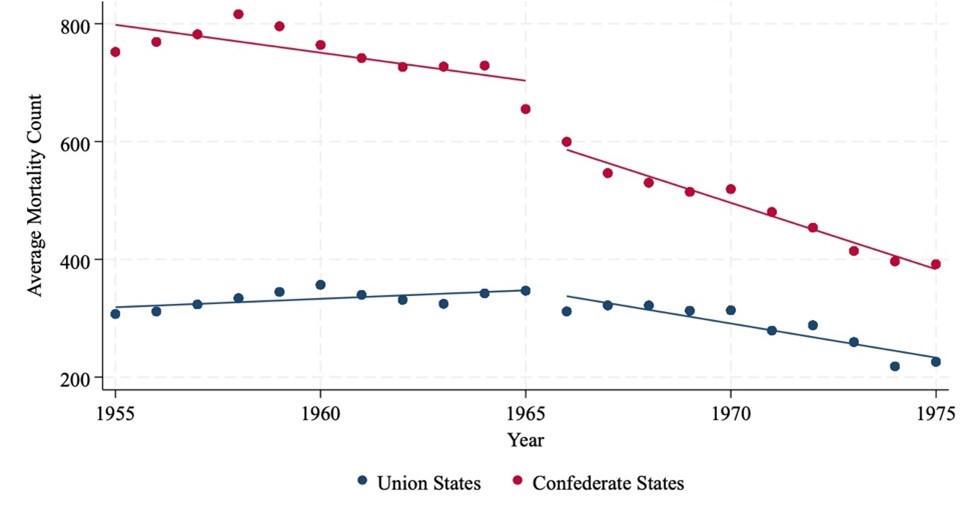
Figure 2 shows Black infant mortality under 28 days from 1955 to 1975. Confederate states had higher mortality than Union states throughout the period. After 1965, mortality declined more steeply in Confederate states, narrowing the gap over time
The figures above demonstrate that the parallel trend assumption is violated for both black infant mortality under one year and under 28 days. The trend in black infant mortality in the South is converging toward black infant mortality in the North. This indicates that the results may overestimate the true difference in outcomes between the North and South due to hospital desegregation.
Following the parallel trends plots, I ran the regression from equation 1 using infant mortality counts under one year, treatment years 1966 and 1967, and using only data on black mortality counts. I repeated this using infant mortality counts under 28 days and treatment years 1966 and 1967. The results for these regressions are summarized in Table 2. The regression of infant mortality under one year suggested that the implementation of Medicare resulted in a 43.62% greater decrease in infant mortality in Confederate states than in Union states. Furthermore, the regression on infant mortality under 28 days indicated that there was a 32.19% greater decrease in infant mortality in Confederate states than in Union states after the implementation of Medicare. These results are significant at the 99% confidence level. The results are not greatly affected by using 1967 instead of 1966 as the treatment date; the difference between coefficients is less than 1 percentage point for mortality counts under one year and under 28 days.
Table 2: Differences-in-Differences Estimate of Effect of Hospital Desegregation on Black Infant Mortality Counts Under One Year and Under 28 Days
| Mortality Under One Year | Mortality Under 28 Days | |||
|---|---|---|---|---|
| VARIABLES | (1) 1966 |
(2) 1967 |
(3) 1966 |
(4) 1967 |
| Confederate State-Treatment Year Interaction | -0.436*** (0.043) |
-0.445*** (0.044) |
-0.322*** (0.040) |
-0.313*** (0.042) |
| Treatment Year | 0.027 (0.039) |
0.023 (0.054) |
-0.008 (0.038) |
-0.023 (0.052) |
| Medicaid | -0.225*** (0.030) |
-0.209*** (0.043) |
-0.177*** (0.026) |
-0.159*** (0.038) |
| State Fixed Effects | Included | Included | Included | Included |
| Constant | 7.174*** (0.013) |
7.155*** (0.012) |
6.623*** (0.012) |
6.604*** (0.010) |
| Observations | 630 | 630 | 624 | 624 |
| R-squared | 0.989 | 0.989 | 0.988 | 0.988 |
Notes: This table displays coefficients from difference-in-differences regressions of equation 1 from the model section. Columns 1 and 2 display results of regressions run using infant mortality rates within one year of age. Columns 3 and 4 show regressions run using infant mortality rates within 28 days of birth. Columns 1 and 3 use 1966 as the treatment year, and columns 2 and 4 use 1967 as the treatment year. Confederate states are the treated group and Union states are the control group. Standard errors are displayed in parentheses below each coefficient.
*p<0.05, **p<0.01 ***p<0.001
To examine if white infant mortality counts were similarly affected by the desegregation of southern hospitals, I repeated the parallel trends plots and regressions using only white mortality counts. The results of these regressions are summarized in Table 3.
Figure 3: White Infant Mortality Under One Year
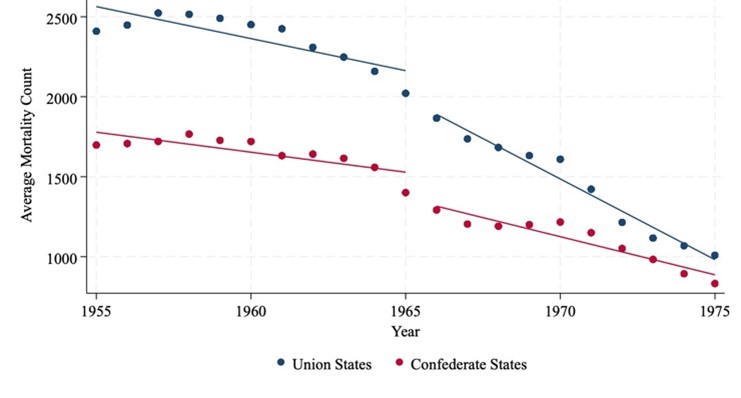
Figure 3 shows white infant mortality under one year from 1955 to 1975. Mortality declined steadily in both Union and Confederate states, with Union states starting higher but experiencing a sharper post-1965 decline, resulting in convergence by 1975
Figure 4: White Infant Mortality Under 28 Days
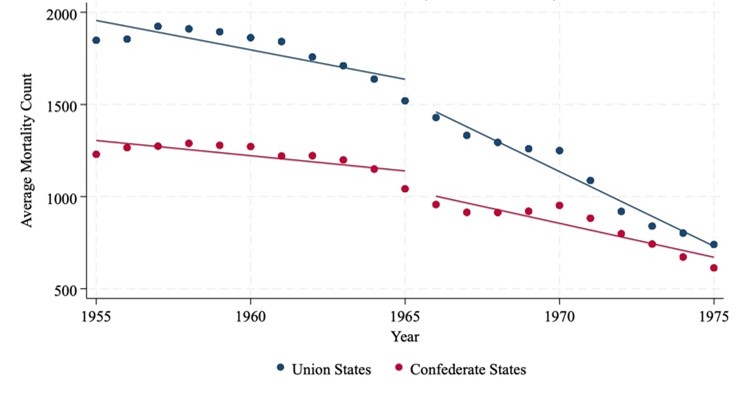
Figure 4 shows white infant mortality under 28 days from 1955 to 1975. Rates declined in both Union and Confederate states, with Union states starting higher but converging with Confederate states by 1975
The plots above indicate that the pre-trends may be more parallel for white infant mortality counts than for black; although, the gap between Union and Confederate states appears to be slightly closing prior to 1966. Thus, the results may slightly overestimate the true difference in outcomes between the North and South due to hospital desegregation. The regression results indicate that the desegregation of southern hospitals resulted in a 5.6% lower decrease in white infant mortality under one year and a 7.18% lower decrease in white infant mortality under 28 days. These results are significant at the 90% confidence level.
Table 3: Differences-in-Differences Estimate of Effect of Hospital Desegregation on White Infant Mortality Counts Under One Year and Under 28 Days
| Mortality Under One Year | Mortality Under 28 Days | |||
|---|---|---|---|---|
| VARIABLES | (1) 1966 |
(2) 1967 |
(3) 1966 |
(4) 1967 |
| Confederate State-Treatment Year Interaction | 0.056* (0.027) |
0.082** (0.027) |
0.072** (0.024) |
0.102*** (0.025) |
| Treatment Year | -0.297*** (0.018) |
-0.333*** (0.018) |
-0.295*** (0.017) |
-0.330*** (0.018) |
| Medicaid | -0.239*** (0.017) 0.000 |
-0.202*** (0.017) 0.000 |
-0.240*** (0.018) 0.000 |
-0.204*** (0.018) 0.000 |
| State Fixed Effects | Included | Included | Included | Included |
| Constant | 7.064*** (0.008) |
7.046*** (0.008) |
6.776*** (0.008) |
6.757*** (0.008) |
| Observations | 649 | 649 | 649 | 649 |
| R-squared | 0.979 | 0.978 | 0.976 | 0.975 |
Notes: This table displays coefficients from difference-in-differences regressions of equation 1 from the model section. Columns 1 and 2 display results of regressions run using infant mortality rates within one year of age. Columns 3 and 4 show regressions run using infant mortality rates within 28 days of birth. Columns 1 and 3 use 1966 as the treatment year, and columns 2 and 4 use 1967 as the treatment year. Confederate states are the treated group and Union states are the control group. Standard errors are displayed in parentheses below each coefficient.
*p<0.05, **p<0.01 ***p<0.001
B. Maternal Mortality
My next regressions examined the effect of southern hospital desegregation on maternal mortality rates. The parallel trends plot for nonwhite maternal mortality rates is shown below. The graph does not demonstrate parallel trends, and the results likely overestimate the difference in nonwhite maternal mortality rates between the North and South that are due to hospital desegregation.
Figure 5 shows nonwhite maternal mortality per 1,000 births from 1960 to 1979. Rates declined in both Union and Confederate states, with Confederate states starting higher but converging toward Union state levels by the late 1970s
Figure 5: Nonwhite Maternal Mortality Rate
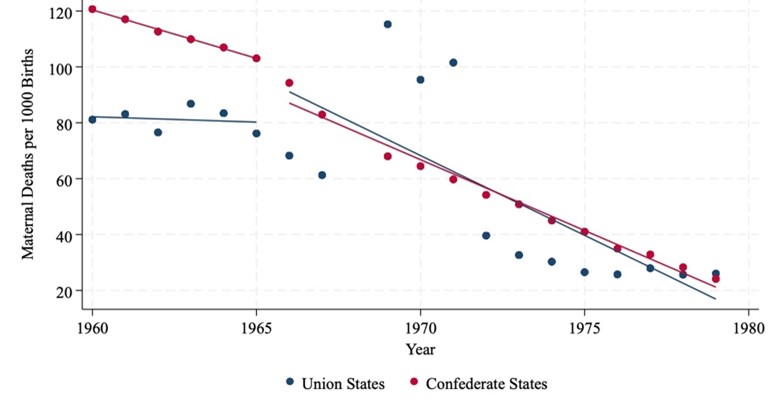
Figure 5 shows nonwhite maternal mortality per 1,000 births from 1960 to 1979. Rates declined in both Union and Confederate states, with Confederate states starting higher but converging toward Union state levels by the late 1970s
I ran the regression from equation 2 with nonwhite maternal mortality rates and years 1966 and 1967 as the start of treatment. The results of this regression are summarized in Table 4. The main finding was that the desegregation of hospitals resulted in 22.24 greater percentage point decrease in maternal deaths per 1000 births in Confederate states versus Union states. The difference decreased to 19.77 percentage points when using 1967 as the treatment start date. Both values are within the 90% confidence level.
Table 4: Differences-in-Differences Estimate of Effect of Hospital Desegregation on Nonwhite Maternal Mortality Rates
| VARIABLES | (1) 1966 |
(2) 1967 |
|---|---|---|
| Confederate State-Treatment Year Interaction | -22.243** (7.187) |
-19.772** (7.137) |
| Treatment Year | -8.037 (5.426) |
-16.473** (5.725) |
| Medicaid | -35.848*** (3.623) |
-27.443*** (3.623) |
| State Fixed Effects | Included | Included |
| Constant | 133.722*** (3.033) |
131.472*** (2.742) |
| Observations | 490 | 490 |
| R-squared | 0.915 | 0.916 |
Notes: This table displays coefficients from difference-in-differences regressions of equation 2 from the model section. Column 1 uses 1966 as the treatment year and column 2 uses 1967. Confederate states are the treated group and Union states are the control group. Standard errors are displayed in parentheses below each coefficient.
*p<0.05, **p<0.01 ***p<0.001
I ran the same regressions using white maternal mortality rates to examine whether white mothers were similarly affected by the hospital desegregation. The parallel trends plot for the white maternal mortality rate is shown below. The graph does not demonstrate parallel trends, and the results likely underestimate the difference in white maternal mortality rates between the North and South that are due to hospital desegregation due to the diverging trends.
Figure 6: White Maternal Mortality Rate
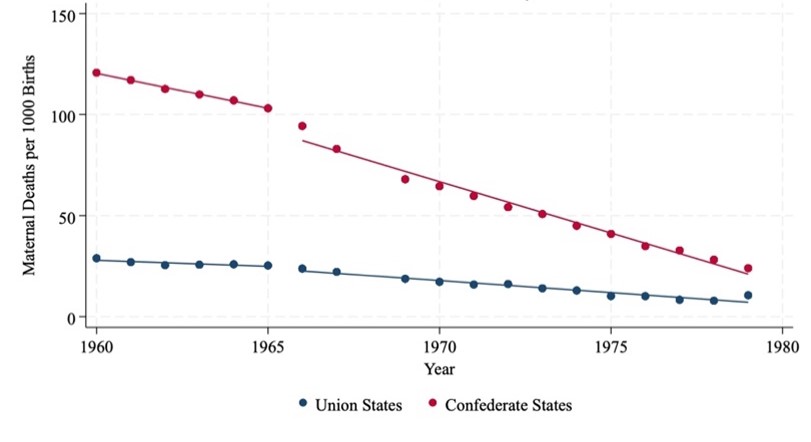
Figure 6 shows nonwhite maternal mortality per 1,000 births from 1960 to 1979. Mortality declined in both Union and Confederate states, with Confederate states starting significantly higher but showing a sharper decline over time
The regression results on white maternal mortality are summarized in Table 5. Using a treatment year of 1966, I estimated that desegregation resulted in a 3.15 greater percentage point decrease maternal deaths per 1000 births in the South than in the North. The result was similar using a treatment year of 1967 with desegregation resulting in a 2.98 greater percentage point decrease in white maternal deaths per 1000 births in the South than in the North. Both results are significant at the 90% confidence level.
Table 5: Differences-in-Differences Estimate of Effect of Hospital Desegregation on White Maternal Mortality Rates
| VARIABLES | (1) 1966 |
(2) 1967 |
|---|---|---|
| Confederate State-Treatment Year Interaction | -3.148* (1.452) |
-2.979* (1.370) |
| Treatment Year | -2.380 (1.506) |
-3.915** 0.007 |
| Medicaid | -7.870*** (1.031) |
-6.179*** (1.006) |
| State Fixed Effects | Included | Included |
| Constant | 28.740*** (0.654) |
28.422*** (0.612) |
| Observations | 578 | 578 |
| R-squared | 0.615 | 0.618 |
Notes: This table displays coefficients from difference-in-differences regressions of equation 2 from the model section. Column 1 uses 1966 as the treatment year and column 2 uses 1967. Confederate states are the treated group and Union states are the control group. Standard errors are displayed in parentheses below each coefficient.
*p<0.05, **p<0.01 ***p<0.001
C. Birth Location
To evaluate the effect of hospital desegregation on birth location and birthing locations, I ran several regressions using equation 3. I used data on the percentage of nonwhite births that took place with a physician in a hospital, a physician not in a hospital, and with a midwife using 1966 and 1967 as treatment years. The parallel trend plots for these three preferences are below. All three plots indicate a violation of the parallel trends assumption and converging trends prior to Medicare implementation. Thus, the results likely overestimate the difference in nonwhite birth location between the North and South that are due to hospital desegregation.
Figure 7: Nonwhite Births to a Physician in a Hospital
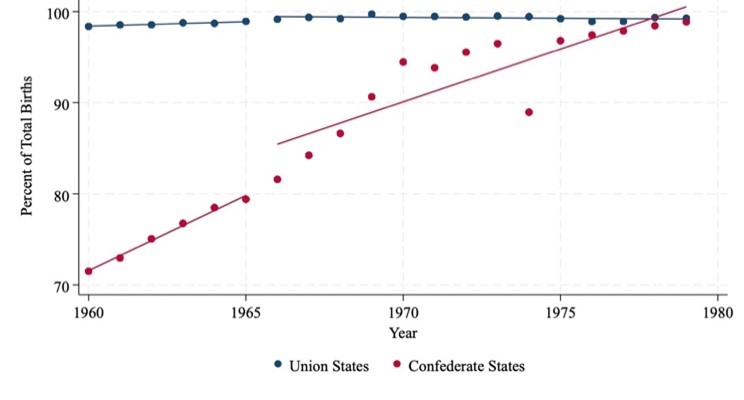
Figure 7 shows the percentage of nonwhite births attended by a physician in a hospital from 1960 to 1979. Rates were consistently high in Union states, while Confederate states saw a significant increase over time, closing the gap by the late 1970s
Figure 8: Nonwhite Births to a Physician not in a Hospital
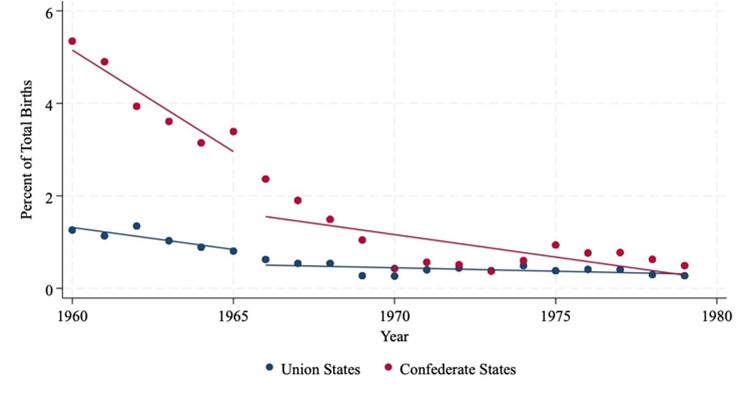
Figure 8 shows the percentage of nonwhite births attended by a physician not in a hospital from 1960 to 1979. Rates declined in both Union and Confederate states, with Confederate states starting higher but converging toward Union state levels over time
Figure 9: Nonwhite Births to a Midwife
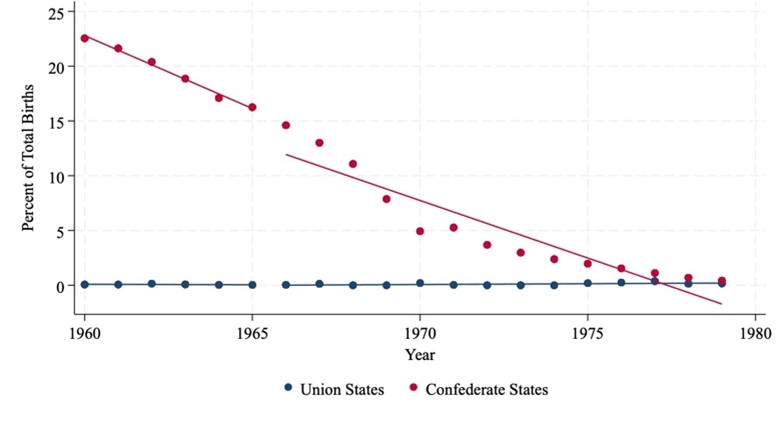
Figure 9 shows the percentage of nonwhite births attended by a midwife from 1960 to 1979. Rates in Confederate states declined sharply from over 20% to near zero, while Union states remained consistently low throughout the period
The results of the regressions on nonwhite birth location are summarized in Table 6. The results indicate that the desegregation of hospitals resulted in a 15.6 greater percentage point increase in nonwhite mothers giving birth to a physician in a hospital in southern states than in northern states. The percentage of births to a physician not in a hospital and to a midwife decreased more in southern states than it did in northern states upon the desegregation of hospitals. These results are significant at the 95% confidence level.
Table 6: Differences-in-Differences Estimate of Effect of Hospital Desegregation on Nonwhite Birth Location
| Physician in Hospital | Physician not in Hospital | Midwife | ||||
|---|---|---|---|---|---|---|
| VARIABLES | (1) 1966 |
(2) 1967 |
(3) 1966 |
(4) 1967 |
(5) 1966 |
(8) 1967 |
| Confederate State-Treatment Year Interaction | 15.556*** (2.880) |
15.614*** (2.918) |
-2.795*** (0.737) |
-3.215*** (0.690) |
-16.017*** (2.847) |
-15.689*** (2.857) |
| Treatment Year | -3.572* (1.573) 0.030 |
-4.282* (1.633) 0.014 |
0.017 (0.510) 0.974 |
1.365* (0.640) 0.041 |
7.675*** (2.020) 0.001 |
7.577*** (2.057) 0.001 |
| Medicaid | -1.128 (1.700) |
-0.835 (1.692) |
7.849*** (0.282) |
6.944*** (0.588) |
-8.020*** (2.077) |
-7.765*** (2.078) |
| State Fixed Effects | Included | Included | Included | Included | Included | Included |
| Constant | 66.831*** (1.844) |
67.683*** (1.771) |
4.649*** (0.298) |
4.372*** (0.266) |
28.012*** (1.756) |
27.328*** (1.686) |
| Observations | 645 | 645 | 596 | 596 | 433 | 433 |
| R-squared | 0.137 | 0.138 | 0.030 | 0.030 | 0.815 | 0.819 |
Notes: This table displays coefficients from difference-in-differences regressions of equation 3 from the model section. Regressions in columns 1 and 2 use the percent of births to a physician in a hospital as the dependent variable. Results in columns 3 and 4 use the percent of births to a physician not in a hospital as the dependent variable. Columns 5 and 6 use the percent of births to a midwife as the dependent variable. Columns 1, 3, and 5 use 1966 as the treatment year; and columns 2, 4, and 6 use 1967 as the treatment year. Confederate states are the treated group and Union states are the control group. Standard errors are displayed in parentheses below each coefficient.
*p<0.05, **p<0.01 ***p<0.001
I ran the same regressions using data on white birthing locations to analyze whether hospital desegregation had an effect on white birth location. The results of these regression are summarized in Table 7, and the parallel trend plots are included below. All three plots indicate a violation of the parallel trends assumption. The trends in white births to a physician in a hospital and to a midwife are converging; thus, the results likely overestimate the difference in white birth location between the North and South that are due to hospital desegregation. The trend in white births to a physician not in a hospital are diverging, so the results likely overestimate the difference.
Figure 10: White Births to a Physician in a Hospital
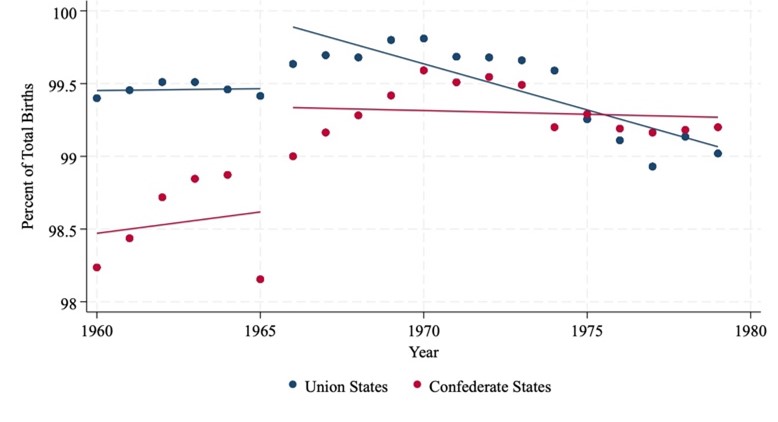
Figure 10 shows the percentage of white births attended by a physician in a hospital from 1960 to 1979. Rates were high in both Union and Confederate states, with slight convergence by the late 1970s
Figure 11: White Births to a Physician not in a Hospital
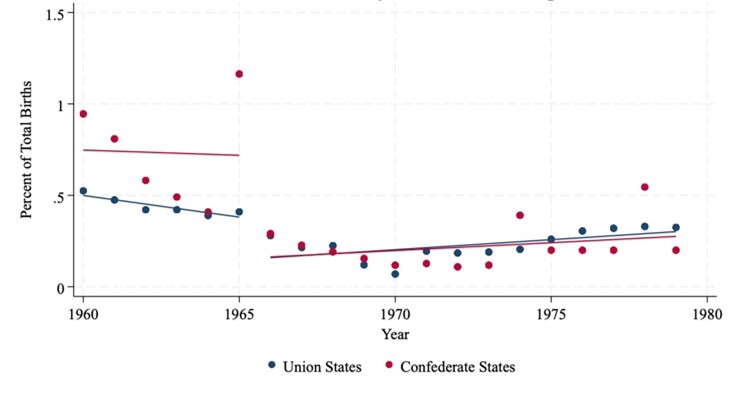
Figure 11 shows the percentage of white births attended by a physician not in a hospital from 1960 to 1979. Rates declined gradually in both Union and Confederate states, with Confederate states starting slightly higher but converging by the late 1970s
Figure 12: White Births to a Midwife
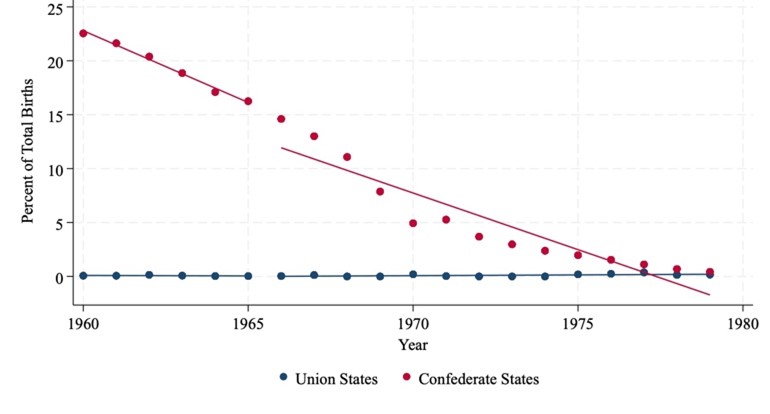
Figure 12 shows the percentage of white births attended by a midwife from 1960 to 1979. Rates in Confederate states declined sharply from over 20% to near zero, while Union states remained consistently close to zero throughout the period
The percentage of white mothers giving birth to a physician not in a hospital and to a midwife decreased more in the South than in the North; however, neither decreased by more than 2 percentage points. Additionally, the percentage of white mothers giving birth to a physician in a hospital decreased by 0.32 more percentage points in the South than the North using 1966 as the treatment year but increased by 0.12 more percentage points in the South than the North using 1967 as the treatment year.
Table 7: Differences-in-Differences Estimate of Effect of Hospital Desegregation on White Birth Location
| Physician in Hospital | Physician not in Hospital | Midwife | ||||
|---|---|---|---|---|---|---|
| VARIABLES | (1) 1966 |
(2) 1967 |
(3) 1966 |
(4) 1967 |
(5) 1966 |
(6) 1967 |
| Confederate State-Treatment Year Interaction | -0.318 (0.337) |
0.116 (0.332) |
-0.303** (0.093) |
-0.262** (0.083) |
-0.444 (0.522) |
-1.047* (0.461) |
| Treatment Year | 0.871*** (0.198) |
-0.341 (0.603) |
-0.171*** (0.042) |
-0.150*** (0.038) |
0.086 (0.435) |
1.575* (0.615) |
| Medicaid | -8.125*** (0.186) |
-7.273*** (0.602) |
-0.039 (0.023) |
-0.040 (0.032) |
8.484*** (0.202) |
7.426*** (0.616) |
| State Fixed Effects | Included | Included | Included | Included | Included | Included |
| Constant | 98.218*** (0.196) |
98.317*** (0.174) |
0.764*** (0.059) |
0.701*** (0.050) |
0.873*** (0.155) |
0.820*** (0.142) |
| Observations | 649 | 649 | 649 | 649 | 566 | 566 |
| R-squared | 0.030 | 0.030 | 0.313 | 0.290 | 0.037 | 0.037 |
Notes: This table displays coefficients from difference-in-differences regressions of equation 3 from the model section. Regressions in columns 1 and 2 use the percent of births to a physician in a hospital as the dependent variable. Results in columns 3 and 4 use the percent of births to a physician not in a hospital as the dependent variable. Columns 5 and 6 use the percent of births to a midwife as the dependent variable. Columns 1, 3, and 5 use 1966 as the treatment year; and columns 2, 4, and 6 use 1967 as the treatment year. Confederate states are the treated group and Union states are the control group. Standard errors are displayed in parentheses below each coefficient.
*p<0.05, **p<0.01 ***p<0.001
D. Robustness Check
The first robustness check I completed was to analyze whether the Civil War border states affect the change in black infant and maternal mortality rates and birth location. In the context of this study, it is unclear whether border states belong in the treatment or control group, because while they aligned with the Union, they were still slave states. For the robustness check, I included these states with Confederate states in the three regression equations and reran each regression using years 1966 and 1967 as the treatment year. I also ran each regression on black/nonwhite and white data sets to confirm that only black/nonwhite mortalities and birth locations were affected by hospital desegregation. I compared the results of these regressions with the main regressions that included only Confederate and Union states. The results of these regression are summarized in Tables A1-A6 located in the appendix.
The inclusion of border states decreased the difference between treated and control black infant mortality counts under one year and 28 days by approximately 1 to 2 percentage points. Regarding nonwhite maternal mortality, including border states in the regression decreased the difference between the maternal mortality rates of treated and control states by approximately 5 percentage points. Differences between nonwhite birth location between treated and control states decreased by 2 to 3 percentage points.
Due to the violation of the parallel trends assumption, I performed a placebo test for each regression. The data for black and white infant mortality counts begins in 1955 and Medicare implementation began in 1965, so I used 1960 as the placebo treatment year. The data on white and non-white maternal mortality and preferences begins in 1960, so I selected 1963 as the treatment year. The results of these regressions are summarized in Tables A7-A12 in the appendix.
The placebo test on black infant mortality counts resulted in an 8.2% larger decrease in infant mortality under one year and 12.3% larger decrease in infant mortality under 28 days in the South compared to the North. These findings are significant to the 95% and 99% confidence level respectively. This result confirms that the trends in black infant mortality were converging before Medicare implementation; however, the decrease in black infant mortality in the South compared to the North is much larger in the original regression. This result indicates that while the original findings are overestimates, the black infant mortality count did decrease more in the South than in the North following the desegregation of hospitals. The placebo test on white infant mortality counts under one year and under 28 days did not yield statistically significant results, suggesting that the parallel trends assumption holds for those regressions.
Both placebo tests on white and nonwhite maternal mortalities did not give statistically significant results. These findings suggest that the observed effect of hospital desegregation was not due to preexisting trends prior to Medicare implementation. The placebo test on nonwhite birth location indicates that births to a physician in a hospital increased by 4.72 more percentage points in the South than in the North in 1933 significant at the 99.9% confidence level. Births to a physician not in a hospital and births to a midwife decreased by 0.97 and 4.1 more in the South compared to the North respectively. These results are significant to the 95% and 99.9% confidence levels. Thus, some of the observed effect of hospital desegregation on Black birth location trends is likely due to preexisting trends between the North and the South. The magnitude of the diff-in-diff results in the treatment year are still much larger in magnitude than the results of the placebo test, indicating that the original findings are overestimates but not entirely invalid.
Additionally, I ran each of my original DiD regressions without the Medicaid dummy variable to examine whether this control made a difference in the results. The results of these regressions are summarized in Tables A13-A18 in the appendix. The exclusion of the Medicaid dummy variable tends to decrease the differences in black infant mortality and nonwhite maternal mortality between the South and the North. It also increases the impact of Medicare implementation alone on infant and maternal mortalities across all races.
VI. Conclusion
This research aims to understand how the desegregation of hospitals affected black and nonwhite maternal and infant mortality rates and birth location with an emphasis on the American South. Through a series of regressions, I found that hospital desegregation resulted in a 43.6% larger decrease in black infant mortality under one year in the South than in the North. Additionally, nonwhite maternal mortality decreased by 22.24 more percentage-points in the South than in the North. These findings suggest that black and nonwhite women in the South benefitted more than black and nonwhite women in the North upon the desegregation of hospitals. Furthermore, the percentage of nonwhite women giving birth with a physician in a hospital in the South increased by 15.6 more percentage-points than it did in the North. When coupled together, these findings indicate that the increase of black and nonwhite births taking place in hospitals in the South may be related to the improvement in outcomes for black and nonwhite infants and mothers.
The findings from this research are important in informing present day economic policy. In the United States, the Black infant mortality rate is 240% greater than the White infant mortality rate and Black women are twice as likely to die in childbirth than White women (U.S. Department of Health and Human Services; Burris et. al., 2021). Based on the decrease in black and nonwhite infant and maternal mortality after the desegregation of hospitals in the American South, a modern-day policy that focuses on reallocating resources and providing underserved communities with robust pre and postnatal care may help decrease the current Black-White infant and maternal mortality gaps in the United States.
VII. References
Almond, Douglas Vincent, Kenneth Y. Chay, and Michael Greenstone. 2006. “Civil Rights, the War on Poverty, and Black-White Convergence in Infant Mortality in the Rural South and Mississippi.” SSRN Electronic Journal. https://doi.org/10.2139/ssrn.961021.
Anderson, D Mark, Kerwin Kofi Charles, and Daniel I Rees. n.d. “THE FEDERAL EFFORT TO DESEGREGATE SOUTHERN HOSPITALS AND THE BLACK-WHITE INFANT MORTALITY GAP.”
Burris, H. H., Passarella, M., Handley, S. C., Srinivas, S. K., & Lorch, S. A. (2021). Black-White disparities in maternal in-hospital mortality according to teaching and Black-serving hospital status. American journal of obstetrics and gynecology, 225(1), 83.e1–83.e9. https://doi.org/10.1016/j.ajog.2021.01.004
Burrows, Vanessa, and Barbara Berney. 2019. “Creating Equal Health Opportunity: How the Medical Civil Rights Movement and the Johnson Administration Desegregated U.S. Hospitals.” Journal of American History 105 (4): 885–911. https://doi.org/10.1093/jahist/jaz004.
Chay, Kenneth Y., and Michael Greenstone. 2000. “The Convergence in Black-White Infant Mortality Rates during the 1960’s.” The American Economic Review 90 (2): 326–32.
Cornely, Paul B. 1956. “Segregation and Discrimination in Medical Care in the United States.” American Journal of Public Health and the Nations Health 46 (9): 1074–81. https://doi.org/10.2105/AJPH.46.9.1074.
“Cornely, Paul B. ‘Segregation and Discrimination in Medical Care in the United States.’ – Google Search.” n.d. Accessed March 26, 2023. https://www.google.com/search?client=safari&rls=en&q=Cornely%2C+Paul+B.+%22Segregation+and+discrimination+in+medical+care+in+the+United+States.%22&ie=UTF-8&oe=UTF-8.
“Facts – The Civil War (U.S. National Park Service).” n.d. Accessed March 15, 2023. https://www.nps.gov/subjects/civilwar/facts.htm.
“Medicare and Medicaid Act (1965).” 2021. National Archives. October 5, 2021. https://www.archives.gov/milestone-documents/medicare-and-medicaid-act.
“Office of Minority Health.” Infant Mortality and African Americans – The Office of Minority Health. Accessed April 12, 2023. https://minorityhealth.hhs.gov/omh/browse.aspx?lvl=4&lvlid=23.
Owens, Deirdre Cooper, and Sharla M. Fett. 2019. “Black Maternal and Infant Health: Historical Legacies of Slavery.” American Journal of Public Health 109 (10): 1342–45. https://doi.org/10.2105/AJPH.2019.305243.
Pohl, L. M. 2000. “Long Waits, Small Spaces, and Compassionate Care: Memories of Race and Medicine in a Mid-Twentieth-Century Southern Community.” Bulletin of the History of Medicine 74 (1): 107–37. https://doi.org/10.1353/bhm.2000.0035.
“Program History | Medicaid.” n.d. Accessed March 20, 2023. https://www.medicaid.gov/about-us/program-history/index.html.
Singh, Gopal K., and Stella M. Yu. 2019. “Infant Mortality in the United States, 1915-2017: Large Social Inequalities Have Persisted for Over a Century.” International Journal of Maternal and Child Health and AIDS 8 (1): 19–31. https://doi.org/10.21106/ijma.271.
Smith, David Barton. 2005. “The Politics of Racial Disparities: Desegregating the Hospitals in Jackson, Mississippi.” The Milbank Quarterly 83 (2): 247–69. https://doi.org/10.1111/j.1468-0009.2005.00346.x.
This work was supported in part by the South Carolina Honors College Senior Thesis Grant.
Appendices
A. Regression Results Tables Including Border States
Table A1: Differences-in-Differences Estimate of Effect of Hospital Desegregation on Black Infant Mortality Counts Under One Year and Under 28 Days Including Border States
| Under One Year | Under 28 Days | |||
|---|---|---|---|---|
| VARIABLES | (1) 1966 |
(2) 1967 |
(3) 1966 |
(4) 1967 |
| Confederate/Border State-Treatment Year Interaction | -0.418*** (0.041) |
-0.428*** (0.042) |
-0.313*** (0.039) |
-0.309*** (0.040) |
| Treatment Year | 0.039 (0.038) |
0.023 (0.052) |
0.005 (0.037) |
-0.020 (0.050) |
| Medicaid | -0.239*** (0.027) |
-0.209*** (0.040) |
-0.192*** (0.025) |
-0.162*** (0.036) |
| State Fixed Effects | Included | Included | Included | Included |
| Constant | 7.163*** (0.013) |
7.148*** (0.011) |
6.617*** (0.012) |
6.602*** (0.010) |
| Observations | 714 | 714 | 708 | 708 |
| R-squared | 0.989 | 0.989 | 0.988 | 0.987 |
Notes: This table displays coefficients from difference-in-differences regressions of equation 1 from the model section. Columns 1 and 2 display results of regressions run using infant mortality rates within one year of age. Columns 3 and 4 show regressions run using infant mortality rates within 28 days of birth. Columns 1 and 3 use 1966 as the treatment year, and columns 2 and 4 use 1967 as the treatment year. Confederate and Border states are the treated group and Union states are the control group. Standard errors are displayed in parentheses below each coefficient.
*p<0.05, **p<0.01 ***p<0.001
Table A2: Differences-in-Differences Estimate of Effect of Hospital Desegregation on White Infant Mortality Counts Under One Year and Under 28 Days Including Border States
| Under One Year | Under 28 Days | |||
|---|---|---|---|---|
| VARIABLES | (1) 1966 |
(2) 1967 |
(3) 1966 |
(4) 1967 |
| Confederate/Border State-Treatment Year Interaction | 0.034 (0.026) |
0.058* (0.026) |
0.052* (0.024) |
0.079** (0.025) |
| Treatment Year | -0.291*** (0.018) |
-0.326*** (0.017) |
-0.290*** (0.017) |
-0.324*** (0.017) |
| Medicaid | -0.246*** (0.015) |
-0.209*** (0.016) |
-0.245*** (0.017) |
-0.211*** (0.017) |
| State Fixed Effects | Included | Included | Included | Included |
| Constant | 7.074*** (0.007) |
7.056*** (0.007) |
6.785*** (0.007) |
6.766*** (0.007) |
| Observations | 733 | 733 | 733 | 733 |
| R-squared | 0.977 | 0.975 | 0.974 | 0.972 |
Notes: This table displays coefficients from difference-in-differences regressions of equation 1 from the model section. Columns 1 and 2 display results of regressions run using infant mortality rates within one year of age. Columns 3 and 4 show regressions run using infant mortality rates within 28 days of birth. Columns 1 and 3 use 1966 as the treatment year, and columns 2 and 4 use 1967 as the treatment year. Confederate and Border states are the treated group and Union states are the control group. Standard errors are displayed in parentheses below each coefficient.
*p<0.05, **p<0.01 ***p<0.001
Table A3: Differences-in-Differences Estimate of Effect of Hospital Desegregation on Nonwhite Maternal Mortality Rates Including Border States
| VARIABLES | (1) 1966 |
(2) 1967 |
|---|---|---|
| Confederate/Border State-Treatment Year Interaction | -17.606* (0.016) |
-14.288* (6.96) |
| Treatment Year | -10.681 (5.474) |
-17.886** (5.689) |
| Medicaid | -32.965*** (3.599) |
-25.895*** (3.418) |
| State Fixed Effects | Included | Included |
| Constant | 130.841*** (2.789) |
128.086*** (2.535) |
| Observations | 562 | 562 |
| R-squared | 0.903 | 0.902 |
Notes: This table displays coefficients from difference-in-differences regressions of equation 2 from the model section. Column 1 uses 1966 as the treatment year and column 2 uses 1967. Confederate and Border states are the treated group and Union states are the control group. Standard errors are displayed in parentheses below each coefficient.
*p<0.05, **p<0.01 ***p<0.001
Table A4: Differences-in-Differences Estimate of Effect of Hospital Desegregation on White Maternal Mortality Rates Including Border States
| VARIABLES | (1) 1966 |
(2) 1967 |
|---|---|---|
| Confederate/Border State-Treatment Year Interaction | -4.275** (1.520) |
-4.040** (1.428) |
| Treatment Year | -1.976 (1.466) |
-3.692** (1.330) |
| Medicaid | -8.313*** (0.973) |
-6.419*** (0.977) |
| Constant | 29.468*** (0.717) |
29.077*** (0.662) |
| Observations | 654 | 654 |
| R-squared | 0.639 | 0.641 |
Notes: This table displays coefficients from difference-in-differences regressions of equation 2 from the model section. Column 1 uses 1966 as the treatment year and column 2 uses 1967. Confederate and Border states are the treated group and Union states are the control group. Standard errors are displayed in parentheses below each coefficient.
*p<0.05, **p<0.01 ***p<0.001
Table A5: Differences-in-Differences Estimate of Effect of Hospital Desegregation on Nonwhite Birth Location Including Border States
| Physician in Hospital | Physician not in Hospital | Midwife | ||||
|---|---|---|---|---|---|---|
| VARIABLES | (1) 1966 |
(2) 1967 |
(3) 1966 |
(4) 1967 |
(5) 1966 |
(6) 1967 |
| Confederate/Border State-Treatment Year Interaction | 12.029*** (2.657) |
12.045*** (2.674) |
-2.638*** (0.696) |
-3.027*** (0.656) |
-12.450*** (2.665) |
-12.154*** (2.652) |
| Treatment Year | -2.894* (1.404) |
-3.477* (1.485) |
0.070 (0.516) |
1.324* (0.625) |
6.461** (1.804) |
6.384** (1.863) |
| Medicaid | -1.866 (1.509) |
-1.701 (1.524) |
7.792*** (0.261) |
6.988*** (0.563) |
-6.730*** (1.868) |
-6.523** (1.892) |
| State Fixed Effects | Included | Included | Included | Included | Included | Included |
| Constant | 69.253*** (1.689) |
69.979*** (1.616) |
4.529*** (0.242) |
4.251*** (0.226) |
25.655*** (1.650) |
25.115*** (1.573) |
| Observations | 729 | 729 | 676 | 676 | 507 | 507 |
| R-squared | 0.116 | 0.117 | 0.029 | 0.029 | 0.755 | 0.756 |
Notes: This table displays coefficients from difference-in-differences regressions of equation 3 from the model section. Regressions in columns 1 and 2 use the percent of births to a physician in a hospital as the dependent variable. Results in columns 3 and 4 use the percent of births to a physician not in a hospital as the dependent variable. Columns 5 and 6 use the percent of births to a midwife as the dependent variable. Columns 1, 3, and 5 use 1966 as the treatment year; and columns 2, 4, and 6 use 1967 as the treatment year. Confederate and Border states are the treated group and Union states are the control group. Standard errors are displayed in parentheses below each coefficient.
*p<0.05, **p<0.01 ***p<0.001
Table A6: Differences-in-Differences Estimate of Effect of Hospital Desegregation on White Birth Location Including Border States
| Physician in Hospital | Physician not in Hospital | Midwife | ||||
|---|---|---|---|---|---|---|
| VARIABLES | (1) 1966 |
(2) 1967 |
(3) 1966 |
(4) 1967 |
(5) 1966 |
(6) 1967 |
| Confederate/Border State-Treatment Year Interaction | 0.151 (0.384) |
0.538 (0.363) |
-0.388*** (0.107) |
-0.338** (0.096) |
-0.745 (0.530) |
-1.297** (0.466) |
| Treatment Year | 0.735*** (0.191) |
-0.421 (0.578) |
-0.155** (0.044) |
-0.135** (0.040) |
0.224 (0.439) |
1.625** (0.594) |
| Medicaid | -7.977*** (0.185) 0.000 |
-7.188*** (0.577) 0.000 |
-0.057* (0.026) 0.036 |
-0.057 (0.033) 0.099 |
8.337*** (0.194) 0.000 |
7.372*** (0.587) 0.000 |
| State Fixed Effects | Included | Included | Included | Included | Included | Included |
| Constant | 97.903*** (0.233) |
98.044*** (0.201) |
0.822*** (0.069) |
0.750*** (0.058) |
1.067*** (0.168) |
0.982*** (0.148) |
| Observations | 733 | 733 | 733 | 733 | 648 | 648 |
| R-squared | 0.029 | 0.029 | 0.361 | 0.332 | 0.035 | 0.036 |
Notes: This table displays coefficients from difference-in-differences regressions of equation 3 from the model section. Regressions in columns 1 and 2 use the percent of births to a physician in a hospital as the dependent variable. Results in columns 3 and 4 use the percent of births to a physician not in a hospital as the dependent variable. Columns 5 and 6 use the percent of births to a midwife as the dependent variable. Columns 1, 3, and 5 use 1966 as the treatment year; and columns 2, 4, and 6 use 1967 as the treatment year. Confederate and Border states are the treated group and Union states are the control group. Standard errors are displayed in parentheses below each coefficient.
*p<0.05, **p<0.01 ***p<0.001
B. Placebo Test Regression Results
Table A7: Differences-in-Differences Placebo Test Estimate on Black Infant Mortality Counts Under One Year and Under 28 Days
| VARIABLES | (1) Under One Year |
(2) Under 28 Days |
|---|---|---|
| Confederate State-Treatment Year Interaction | -0.082* (0.039) |
-0.123** (0.039) |
| Treatment Year | 0.023 (0.036) |
0.041 (0.032) |
| State Fixed Effects | Included | Included |
| Constant | 7.230*** (0.008) |
6.706*** (0.012) |
| Observations | 331 | 329 |
| R-squared | 0.992 | 0.991 |
Notes: This table displays coefficients from difference-in-differences regressions of equation 1 from the model section. Columns 1 displays the results of the regressions run using infant mortality rates within one year of age and Column 2 uses infant mortality rates within 28 days of birth. The treatment year is 1960. Confederate states are the treated group and Union states are the control group. Standard errors are displayed in parentheses below each coefficient.
*p<0.05, **p<0.01 ***p<0.001
Table A8: Differences-in-Differences Placebo Test Estimate on White Infant Mortality Counts Under One Year and Under 28 Days
| VARIABLES | (1) Under One Year |
(2) Under 28 Days |
|---|---|---|
| Confederate State-Treatment Year Interaction | 0.007 (0.028) |
0.011 (0.027) |
| Treatment Year | -0.072** (0.021) |
-0.072** (0.021) |
| State Fixed Effects | Included | Included |
| Constant | 7.126*** (0.010) |
6.838*** (0.009) |
| Observations | 339 | 339 |
| R-squared | 0.994 | 0.993 |
Notes: This table displays coefficients from difference-in-differences regressions of equation 1 from the model section. Columns 1 displays the results of the regressions run using infant mortality rates within one year of age and Column 2 uses infant mortality rates within 28 days of birth. The treatment year is 1960. Confederate states are the treated group and Union states are the control group. Standard errors are displayed in parentheses below each coefficient.
*p<0.05, **p<0.01 ***p<0.001
Table A9: Differences-in-Differences Placebo Test Estimate on Nonwhite Maternal Mortality Rates
| VARIABLES | (1) |
|---|---|
| Confederate State-Treatment Year Interaction | -11.254 (6.639) |
| Treatment Year | 1.099 (5.147) |
| State Fixed Effects | Included |
| Constant | 151.144*** (2.097) |
| Observations | 163 |
| R-squared | 0.749 |
Notes: This table displays coefficients from difference-in-differences regressions of equation 2 from the model section using 1963 as the treatment year. Confederate states are the treated group and Union states are the control group. Standard errors are displayed in parentheses below each coefficient.
*p<0.05, **p<0.01 ***p<0.001
Table A10: Differences-in-Differences Placebo Test Estimate on White Maternal Mortality Rates
| VARIABLES | (1) |
|---|---|
| Confederate State-Treatment Year Interaction | 2.103 (1.263) |
| Treatment Year | -3.575*** (0.906) |
| State Fixed Effects | Included |
| Constant | 33.436*** (0.440) |
| Observations | 183 |
| R-squared | 0.717 |
Notes: This table displays coefficients from difference-in-differences regressions of equation 2 from the model section using 1963 as the treatment year. Confederate states are the treated group and Union states are the control group. Standard errors are displayed in parentheses below each coefficient.
*p<0.05, **p<0.01 ***p<0.001
Table A11: Differences-in-Differences Placebo Test Estimate on Nonwhite Birth Location
| VARIABLES | (1) Physician in Hospital |
(2) Physician not in Hospital |
(3) Midwife |
|---|---|---|---|
| Confederate State-Treatment Year Interaction | 4.718*** (0.675) |
-0.968* (0.406) |
-4.101*** (0.619) |
| Treatment Year | 0.315** (0.108) |
-0.378 (0.223) |
-0.017 (0.023) |
| State Fixed Effects | Included | Included | Included |
| Constant | 56.367*** (0.333) |
5.156*** (0.170) |
37.809*** (0.309) |
| Observations | 184 | 176 | 140 |
| R-squared | 0.993 | 0.899 | 0.993 |
Notes: This table displays coefficients from difference-in-differences regressions of equation 3 from the model section using 1933 as the treatment year. Regressions in columns 1 and 2 use the percent of births to a physician in a hospital as the dependent variable. Results in columns 3 and 4 use the percent of births to a physician not in a hospital as the dependent variable. Columns 5 and 6 use the percent of births to a midwife as the dependent variable. Confederate states are the treated group and Union states are the control group. Standard errors are displayed in parentheses below each coefficient.
*p<0.05, **p<0.01 ***p<0.001
Table A12: Differences-in-Differences Placebo Test Estimate on White Birth Location
| VARIABLES | (1) Physician in Hospital |
(2) Physician not in Hospital |
(3) Midwife |
|---|---|---|---|
| Confederate State-Treatment Year Interaction | 0.154 (0.234) |
-0.023 (0.225) |
-0.137*** (0.027) |
| Treatment Year | 0.007 (0.042) |
-0.068 (0.048) |
-0.005 (0.006) |
| State Fixed Effects | Included | Included | Included |
| Constant | 98.336*** (0.115) |
0.895*** (0.110) |
0.721*** (0.013) |
| Observations | 184 | 184 | 156 |
| R-squared | 0.773 | 0.315 | 0.994 |
Notes: This table displays coefficients from difference-in-differences regressions of equation 3 from the model section using 1933 as the treatment year. Regressions in columns 1 and 2 use the percent of births to a physician in a hospital as the dependent variable. Results in columns 3 and 4 use the percent of births to a physician not in a hospital as the dependent variable. Columns 5 and 6 use the percent of births to a midwife as the dependent variable. Confederate states are the treated group and Union states are the control group. Standard errors are displayed in parentheses below each coefficient.
*p<0.05, **p<0.01 ***p<0.001
C. Regression Results Tables Excluding Medicaid Dummy
Table A13: Differences-in-Differences Estimate of Effect of Hospital Desegregation on Black Infant Mortality Counts Under One Year and Under 28 Days Excluding Medicaid Control
| Under One Year | Under 28 Days | |||
|---|---|---|---|---|
| VARIABLES | (1) 1966 |
(2) 1967 |
(3) 1966 |
(4) 1967 |
| Confederate State-Treatment Year Interaction | -0.394*** (0.038) |
-0.411*** (0.039) |
-0.290*** (0.038) |
-0.287*** (0.039) |
| Treatment Year | -0.168*** (0.029) |
-0.170*** (0.030) |
-0.162*** (0.030) |
-0.168*** (0.031) |
| Medicaid | Excluded | Excluded | Excluded | Excluded |
| State Fixed Effects | Included | Included | Included | Included |
| Constant | 7.182*** (0.012) |
7.163*** (0.011) |
6.630*** (0.012) |
6.610*** (0.010) |
| Observations | 630 | 630 | 624 | 624 |
| R-squared | 0.988 | 0.989 | 0.988 | 0.988 |
Notes: This table displays coefficients from difference-in-differences regressions of equation 1 from the model section. Columns 1 and 2 display results of regressions run using infant mortality rates within one year of age. Columns 3 and 4 show regressions run using infant mortality rates within 28 days of birth. Columns 1 and 3 use 1966 as the treatment year, and columns 2 and 4 use 1967 as the treatment year. Confederate states are the treated group and Union states are the control group. Standard errors are displayed in parentheses below each coefficient.
*p<0.05, **p<0.01 ***p<0.001
Table A14: Differences-in-Differences Estimate of Effect of Hospital Desegregation on White Infant Mortality Counts Under One Year and Under 28 Days Excluding Medicaid Control
| Under One Year | Under 28 Days | |||
|---|---|---|---|---|
| VARIABLES | (1) 1966 |
(2) 1967 |
(3) 1966 |
(4) 1967 |
| Confederate State-Treatment Year Interaction | 0.103*** (0.028) |
0.116*** (0.028) |
0.118*** (0.025) |
0.136*** (0.026) |
| Treatment Year | -0.507*** (0.021) |
-0.520*** (0.021) |
-0.505*** (0.019) |
-0.519*** (0.018) |
| Medicaid | Excluded | Excluded | Excluded | Excluded |
| State Fixed Effects | Included | Included | Included | Included |
| Constant | 7.073*** (0.009) |
7.054*** (0.008) |
6.785*** (0.008) |
6.765*** (0.008) |
| Observations | 649 | 649 | 649 | 649 |
| R-squared | 0.975 | 0.976 | 0.972 | 0.973 |
Notes: This table displays coefficients from difference-in-differences regressions of equation 1 from the model section. Columns 1 and 2 display results of regressions run using infant mortality rates within one year of age. Columns 3 and 4 show regressions run using infant mortality rates within 28 days of birth. Columns 1 and 3 use 1966 as the treatment year, and columns 2 and 4 use 1967 as the treatment year. Confederate states are the treated group and Union states are the control group. Standard errors are displayed in parentheses below each coefficient.
*p<0.05, **p<0.01 ***p<0.001
Table A15: Differences-in-Differences Estimate of Effect of Hospital Desegregation on Nonwhite Maternal Mortality Rates Excluding Medicaid Control
| VARIABLES | (1) 1966 |
(2) 1967 |
|---|---|---|
| Confederate State-Treatment Year Interaction | -18.448* (6.905) |
-18.833* (7.132) |
| Treatment Year | -40.911*** (5.613) |
-41.528*** (5.880) |
| Medicaid | Excluded | Excluded |
| State Fixed Effects | Included | Included |
| Constant | 134.751*** (2.752) |
132.260*** (2.548) |
| Observations | 490 | 490 |
| R-squared | 0.896 | 0.908 |
Notes: This table displays coefficients from difference-in-differences regressions of equation 2 from the model section. Column 1 uses 1966 as the treatment year and column 2 uses 1967. Confederate states are the treated group and Union states are the control group. Standard errors are displayed in parentheses below each coefficient.
*p<0.05, **p<0.01 ***p<0.001
Table A16: Differences-in-Differences Estimate of Effect of Hospital Desegregation on White Maternal Mortality Rates Excluding Medicaid Control
| VARIABLES | (1) 1966 |
(2) 1967 |
|---|---|---|
| Confederate State-Treatment Year Interaction | -2.350 (1.439) |
-2.650 (1.385) |
| Treatment Year | -9.553*** (1.074) |
-9.669*** (0.975) |
| Medicaid | Excluded | Excluded |
| State Fixed Effects | Included | Included |
| Constant | 28.960*** (0.655) |
28.596*** (0.621) |
| Observations | 578 | 578 |
| R-squared | 0.548 | 0.593 |
Notes: This table displays coefficients from difference-in-differences regressions of equation 2 from the model section. Column 1 uses 1966 as the treatment year and column 2 uses 1967. Confederate states are the treated group and Union states are the control group. Standard errors are displayed in parentheses below each coefficient.
*p<0.05, **p<0.01 ***p<0.001
Table A17: Differences-in-Differences Estimate of Effect of Hospital Desegregation on Nonwhite Birth Location Excluding Medicaid Control
| Physician in Hospital | Physician not in Hospital | Midwife | ||||
|---|---|---|---|---|---|---|
| VARIABLES | (1) 1966 |
(2) 1967 |
(3) 1966 |
(4) 1967 |
(5) 1966 |
(6) 1967 |
| Confederate State-Treatment Year Interaction | 15.702*** (2.734) |
15.685*** (2.820) |
-3.835*** (0.762) |
-3.772*** (0.749) |
-14.785*** (2.462) |
-14.791*** (2.540) |
| Treatment Year | -4.607*** (0.632) |
-5.058*** (0.671) |
7.241*** (0.593) |
7.784*** (0.591) |
0.124* (0.056) |
0.123* (0.055) |
| Medicaid | Excluded | Excluded | Excluded | Excluded | Excluded | Excluded |
| State Fixed Effects | Included | Included | Included | Included | Included | Included |
| Constant | 66.875*** (1.900) |
67.715*** (1.826) |
4.343*** (0.342) |
4.102*** (0.306) |
28.324*** (1.758) |
27.631*** (1.693) |
| Observations | 645 | 645 | 596 | 596 | 433 | 433 |
| R-squared | 0.136 | 0.138 | 0.020 | 0.025 | 0.753 | 0.779 |
Notes: This table displays coefficients from difference-in-differences regressions of equation 3 from the model section. Regressions in columns 1 and 2 use the percent of births to a physician in a hospital as the dependent variable. Results in columns 3 and 4 use the percent of births to a physician not in a hospital as the dependent variable. Columns 5 and 6 use the percent of births to a midwife as the dependent variable. Columns 1, 3, and 5 use 1966 as the treatment year; and columns 2, 4, and 6 use 1967 as the treatment year. Confederate states are the treated group and Union states are the control group. Standard errors are displayed in parentheses below each coefficient.
*p<0.05, **p<0.01 ***p<0.001
Table A18: Differences-in-Differences Estimate of Effect of Hospital Desegregation on White Birth Location Excluding Medicaid Control
| Physician in Hospital | Physician not in Hospital | Midwife | ||||
|---|---|---|---|---|---|---|
| VARIABLES | (1) 1966 |
(2) 1967 |
(3) 1966 |
(4) 1967 |
(5) 1966 |
(6) 1967 |
| Confederate State-Treatment Year Interaction | 0.748*** (0.164) |
0.741*** (0.168) |
-0.298** (0.092) |
-0.259** (0.082) |
-1.699** (0.472) |
-1.641*** (0.428) |
| Treatment Year | -6.597*** (0.067) |
-7.106*** (0.068) |
-0.207*** (0.038) |
-0.187*** (0.032) |
8.026*** (0.462) |
8.438*** (0.414) |
| Medicaid | Excluded | Excluded | Excluded | Excluded | Excluded | Excluded |
| State Fixed Effects | Included | Included | Included | Included | Included | Included |
| Constant | 98.535*** (0.107) |
98.600*** (0.102) |
0.765*** (0.060) |
0.702*** (0.051) |
0.543*** (0.070) |
0.531*** (0.072) |
| Observations | 649 | 649 | 649 | 649 | 566 | 566 |
| R-squared | 0.019 | 0.024 | 0.312 | 0.289 | 0.027 | 0.031 |
Notes: This table displays coefficients from difference-in-differences regressions of equation 3 from the model section. Regressions in columns 1 and 2 use the percent of births to a physician in a hospital as the dependent variable. Results in columns 3 and 4 use the percent of births to a physician not in a hospital as the dependent variable. Columns 5 and 6 use the percent of births to a midwife as the dependent variable. Columns 1, 3, and 5 use 1966 as the treatment year; and columns 2, 4, and 6 use 1967 as the treatment year. Confederate states are the treated group and Union states are the control group. Standard errors are displayed in parentheses below each coefficient.
*p<0.05, **p<0.01 ***p<0.001