Spring 2023: Lindsay Bennett
Digital Exclusion: Analyzing Disparities
in Internet Access for Disabled and Vulnerable People
Lindsay Bennett
Media Analytics, Elon University
Submitted in partial fulfillment of the requirements in an undergraduate senior capstone course in communications
Abstract
Using the annual Internet Use Survey conducted by the National Telecommunications and Information Administration (NTIA), this study compares the use of the internet at home, work, and school by individuals with and without disabilities. An analysis of this data from 2011-2021 revealed a lasting disparity between the access of disabled people to the internet and that of non-disabled people. Over time, there is a steady decrease in the gap between disabled and non-disabled people in terms of their proportion of internet access at home. In contrast, the difference in the proportion of schoolchildren with access to the internet has not changed significantly since 2015. According to an analysis of internet access at work, non-disabled individuals tend to have better access to the internet than disabled individuals.
Keywords: web accessibility, digital divide, internet access, disability
Email: lbennett7@elon.edu
1. Introduction
Schools, workplaces, and households in the United States often employ computers in their environments, making digital devices the most common means of sharing, and acquiring new information. According to Pew Research, the proportion of young adults (18-29) who use the internet is around 99%, and the proportion of U.S. adults who receive the news from a digital device is around 86% (Smith, 2020). The increasingly large online audience for news sources pushes the industry towards a fully digital presence, which sounds futuristic and innovative, but fails to consider the proportion of those in the United States without access to the internet. In 2001, research was conducted into the digital divide, a phenomenon where people with access to the internet are equipped with tools and resources, while people without access are left behind, without information or tools to gain it (Cullen, 2001). Further research found that limits to digital accessibility are directly related to the digital divide, and have negative consequences, both socially and economically, for vulnerable groups (Bach, Shaffer, & Wolfson, 2013).
Digital accessibility and inclusion are rising issues in the world of mass communication (Coppula, 1997). As professional, academic, and social responsibilities move towards a digital framework, those without safe and easy access to the internet are left behind (Bach, Shaffer, & Wolfson, 2013). The digital divide is defined as “the gap that exists between those with ready access to the tools of information and communication technologies, and the knowledge that they provide access to, and those without such access or skills,” and research has found evidence of this disparity in many first-world countries, including the United States (Cullen, 2001). Previous research has focused on the implications of accessibility as it affects vulnerable groups, ranging from middle-school children to lower-class individuals in poverty (Hirblinger, 2020). With empirical evidence of digital accessibility affecting vulnerable people, this research aims to investigate the differences in access to the internet among people with and without disabilities.
The Knowledge Gap theory proposes that information is diffused differently throughout society, affecting the information received by individuals (Chatman & Pendleton, 2010). Since information in today’s climate is diffused through digital environments, those without access to those technologies will not receive information. This disparity is at the heart of the digital divide, which has been proven to have negative consequences (Bach, Shaffer, & Wolfson, 2013).
This study analyzes the relationship between disability status and access to the internet, based on data collected by the National Telecommunications and Information Association (NTIA) from 1994 to 2021.
II. Literature Review
To better understand digital accessibility, this literature review explored the social and economic implications of improving accessibility, narrowed down the technical aspects that define accessibility, and defined and explained the digital divide. The digital divide causes inequalities among information received through online platforms, which have negative social and economic implications. Digital accessibility is proposed as a possible solution for the divide, making it easier for vulnerable individuals to access information on the internet efficiently.
Experts have defined accessibility as “the extent to which a product, device, service, or environment is available and navigable for persons with disabilities, or for persons with other special needs or functional limitations” (Kulkarni, 2019). In today’s digital environment, accessibility can refer to a person’s ability to read articles, listen to music, search the internet, and communicate with their family and friends. The digital aspect of “digital accessibility” can include a variety of multimedia platforms, but most commonly refers to websites and applications.
Gregg Venderheiden, a pioneer of computer literacy, was an important catalyst in making technology more accessible. He has been named a “revolutionary” in website accessibility and frequently stressed the importance of accessibility for people with disabilities (Coppula, 1997). Venderheiden emphasized people with disabilities’ need to use technology in their everyday lives, just like able-bodied people.
The criteria for vulnerable people in the United States can refer to a range of characteristics, all of which may be impacted differently by digital exclusion. Qualitative analysis performed on research studies revealed that segmenting vulnerable groups by race, income level, education status, disability status, and sex may be beneficial when analyzing digital accessibility (Perez-Escolar et al., 2022). This research study focuses on disability status and its relationship to access to the internet.
The Americans with Disabilities Act (ADA) of 1990 set a foundational standard for accessibility and criteria for designing accessible online platforms. However, research conducted nearly 20 years later reveals that many school websites did not adhere to these guidelines (Bray et al., 2007). The discrepancies revealed severe errors that may create barriers for students with disabilities.
Other relevant standards for media producers include the Web Content Accessibility Guidelines, a list of criteria for website designers and software developers to consider and follow when creating online platforms. The guidelines cater to a variety of disabilities from deafness to blindness to loss of limbs. These guidelines have been analyzed to showcase the disparities in current technology and to suggest room for improvement (Simeone, 2007).
Defining the Digital Divide
The digital divide began between the late 1990s and early 2000s when innovation in technology was blossoming. While some were able to afford the newest phones and laptops, others read the newspaper out of necessity or tradition. This divide in itself is not harmful to those who prefer or need print resources, but businesses and media companies saw that money was being spent and invested into technology and followed suit. Soon, the internet became the primary source of news distribution, leaving those with newspapers with outdated stories and less communication. Separation of this kind, also known as the digital divide, refers to “the gap that exists between those with ready access to the tools of information and communication technologies, and the knowledge that they provide access to, and those without such access or skills” (Cullen, 2001).
Digital divide research has classified four types of accessibility: motivational, physical, skills, and usage. Motivational accessibility refers to an individual’s personal preference towards adapting to modern technology. Some individuals, particularly older individuals, may prefer traditional news sources and print resources. Physical accessibility refers to an individual’s access to the internet and a device, which will be further explored in this study. Accessibility in terms of skill refers to the knowledge and experience necessary to operate online platforms. Lastly, accessibility in terms of usage refers to an individual’s ability to interact with the online interface and platform characteristics. Research found that the divide in physical access seems to be closing, whereas the divide in usage and skills persists (van Dijk, 2006).
In addition to changing definitions of accessibility, the digital divide can present differently based on the location of internet access, or lack thereof. Most commonly in today’s digital climate, the internet is used at home to shop online and find entertainment, at school to take online classes and search for information, and at work to search for jobs and manage financial information. Research into the location-based digital divide found that online platforms have tangible benefits when searching for health information, making purchases, and managing finances online (Hassani, 2006). Those without access are unable to participate in these activities, which may hinder their quality of life.
In an article by The Internet Society, accessibility and the digital divide were defined using five variables: availability, affordability, quality, relevance, and other areas that create inequalities (Muller, 2022). The availability divide refers to the difference in people with internet access and without internet access in a particular area.
This study will focus on the availability divide and whether disabled people are more likely to suffer from the divide. The affordability divide explains how some individuals are left out of internet access because of their financial or social statuses. The quality divide refers to more technical aspects of website accessibility, such as loading speeds. Relevance division is caused when people without technological skills and knowledge are unable to locate information and develop their online skills. Lastly, there are additional areas of divides related to security and digital literacy (Muller, 2022). Many of these divides may have overlapping instances where individuals fall into multiple categories, creating a complex web of disparities in the online environment.
Social and Economic Implications of Accessibility
Digital inclusivity is a complicated concept that involves not only making sure people have access to the internet, but also ensuring that they have equal opportunity to receive any information published. Limited access to information on the internet can have drastic consequences, most of which involve a warped worldview and pit of misinformation. Research on digital inclusivity has found that increased inclusivity has positive correlations with peace mediation (Hirblinger, 2020). In contrast, those excluded from the online world may miss out on civic engagement, the ability to make social change, and their personal economic advancement (Bach, Shaffer, & Wolfson, 2013).
While digital accessibility begins with accessing the internet, there are several other criteria that make an accessible platform. In terms of disabilities, websites can be designed with accessibility in mind to help the person use the platform efficiently. Some disability-friendly aspects of website design include content accessibility tools, allowing users to add captions or read image descriptions aloud (Williams, 2012). Websites can be designed with mobile accessibility in mind by optimizing their platform for smaller screens and more scrolling. Lastly, online platforms can be altered for accessibility by including translation tools to overcome potential language barriers.
Research Questions and Hypotheses
This research aims to build on previous discoveries that the digital divide can refer to physical access and availability of the internet, that people with disabilities may face obstacles when accessing the internet, and that there are negative social and economic implications for people who face difficulties accessing the internet. As a framework for the analysis of internet access at home, school, and work and disabilities in the United States, this research asked the following questions:
RQ1: Is there a significant difference in internet access at home between people with a disability and people without?
H1: People with a disability are less likely to have a computer and/or internet access at home.
RQ2: Is there a significant difference in internet access at work between people with a disability and people without?
H2: People with a disability are less likely to have internet access for work or work-related activities.
RQ3: Is there a significant difference in internet access at school between people with a disability and people without?
H3: People with a disability are less likely to have a computer and/or internet access for school-related activities.
III. Methods
This research relied on two existing surveys to analyze the difference in internet access between people with a disability and those without. The survey datasets used in this study come from the U.S. Census Bureau’s annual Current Population Survey and the National Telecommunications and Information Administration’s Internet Use Survey. Survey data from the U.S. Census allows for results that can be generalized to the entire population. A large survey sample can lead to a greater statistical power, and the ability to draw more objective conclusions.
Previous research on internet access and accessibility (Hassani, 2006) used data from the Current Population Survey, a survey of the demographic and economic characteristics of the U.S. population, to make inferences about internet access and its relation to income level and education. The NTIA’s Internet Use Survey is administered as a supplement to the Current Population Survey.
Participants for the surveys were obtained through distribution of the U.S. Census Bureau’s annual survey and represent over 60,000 households from all 50 states and the District of Columbia. The U.S. Census Bureau administers the survey over a period of 16 months, where participants were surveyed for four months consecutively, given an eight-month break, and finally surveyed for the last consecutive four months (U.S. Census Bureau, 2021). In 1994, the National Telecommunications and Information Administration added questions about internet use to the Census Bureau’s Current Population Survey (National Telecommunications and Information Administration, 2021). This research analyzes participants’ data from both the Current Population Survey and Internet Use Survey from 1994 until 2021. The study will examine data on the participants’ demographics including age and disability status, and their access to the internet at home, work, and school.
IV. Findings
Data from the Internet Use Survey contained more than 300 million responses about participants’ access to the internet and demographics. From this data, this research found 207,565,076 responses that were relevant to examining internet access at home, work, and school. The Internet Use Survey collected data from 1994-2021, however, disability demographics were introduced to the survey in 2010 for home internet access and 2011 for work and school internet access. Furthermore, data was collected on people from ages 3-65 and over. The final dataset for this research contained responses from about 210 million people ages 15-65 and over from 2010-2021.
Raw data from the Internet Use Survey was processed using R software into separate datasets depending on internet access at home, school, or work. Internet and computer access at home was defined as people who reported having access to the internet from home, access to a computer in their household, or access to a mobile device from their household. Internet access for work and work-related activities was defined by people who reported using the internet at work, using the internet to search for jobs, or using the internet to manage their finances on the Internet Use Survey. Internet access for school and online learning was defined by people who reported using the internet at school, using a computer for online training or courses, or using the computer from a public library on the Internet Use Survey.
The respective datasets each contained ordinal and interval data about disability status, data collection year, and number of people with internet access. Analysis of internet access included Welch’s T-Test and Student’s T-Test, which allow for comparison of means between disability statuses and indicate statistical significance.
Internet and Computer Access at Home
People with internet access in the United States vary in age, disability, and type of internet access. Access to the internet has increased since data collection on disability status for people with home internet access began in 2010. Among people with access to the internet or a computer at home in 2021, most were between the ages of 25-44 (35.74%). More people with internet access at home were between the ages 45-64 (32.60%) than 15-24 year-olds (18.12%) or people above 65 years old (13.54%). In the 2021 data, nearly 10% of the people who reported having internet access or computer access at home also reported having a disability, and 90% did not have a disability. In total, 207,565,076 people reported having internet access or computer access at home in 2021.
In Figure 1, the two solid lines represent the percentage of people with internet access at home among disabled and non-disabled people, and the dotted line indicates the difference between the two groups. This graph illustrates a decrease in the difference in percentage of internet access, in other words, a narrowing of the digital divide. In 2010, when disability status for people with home internet access was introduced to the Current Population Survey, 61% of non-disabled people had access to the internet at home, whereas only 19% of disabled people had home access to the internet. In the past eleven years, the difference has decreased from 42% to 17%, suggesting progress in accessibility efforts.
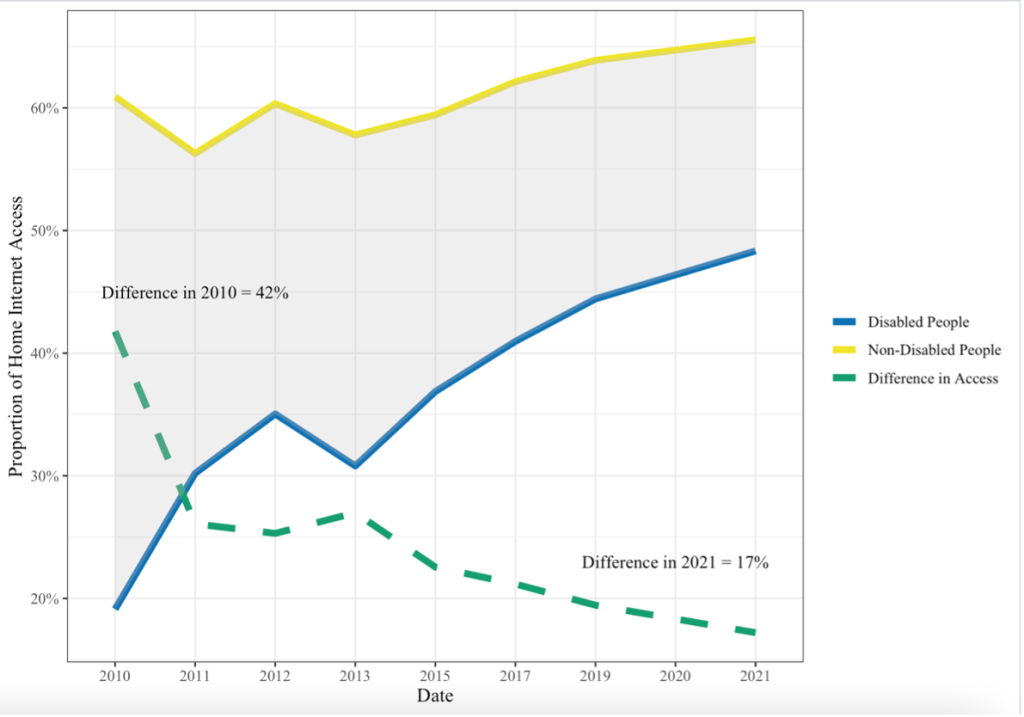
Figure 1
Percentages of Disabled and Non-Disabled People with Home Internet Access (2010-2021)
A Welch’s Two Independent Sample T-Test was conducted to compare home internet access between those with and without a disability. It was hypothesized that the proportion of people without a disability and home internet access is significantly larger than the proportion of people with a disability and home internet access. The hypothesis was supported as the digital divide in home internet access was found to be significant for those with disabilities (p < 0.01).
Internet Access For Work and Work-Related Activities
Among people with access to the internet for work or work-related activities in 2021, most were between the ages of 25-44 (46.42%). More people with internet access for work were between the ages 45-64 (39.46%) than 15–24-year-olds (8.70%) or people above 65 years old (5.42%). In the 2021 data, only 4% of the people who reported having internet access for work or work-related activities also reported having a disability, and 96% did not have a disability. In total, 92,723,743 people in the United States reported having internet access for work or work-related activities in 2021.
In Figure 2, the difference in percentage of internet access for work between disabled and non-disabled people is illustrated by the shaded gray region and the dashed green line. Percentages of people with internet access for work were determined through populations of disabled and non-disabled employed people. Unlike data on home internet access, disability status for work internet access was not collected until 2011. This graph illustrates a gradual decrease in the difference in percentage of internet access for work, suggesting more accessible workplaces in recent years. In 2011, 56% of non-disabled people had access to the internet for work, whereas only 31% of disabled people had internet access for work or work-related activities. In the past ten years, the difference has decreased to 16%, indicating a narrower digital divide.
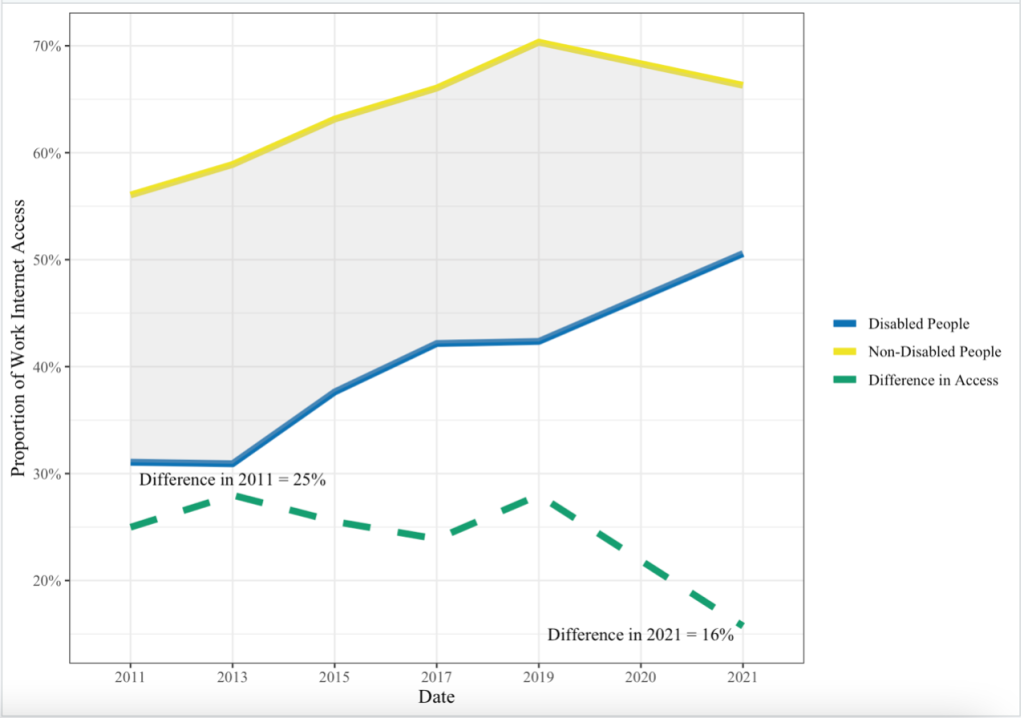
Figure 2
Percentages of Disabled and Non-Disabled People with Internet Access for Work (2011-2021)
A Student’s Two Independent Sample T-Test was conducted to compare the average proportion of people with internet access for work between people with and without a disability. It was hypothesized that the proportion of non-disabled people with internet access for work is significantly larger than the proportion of disabled people with internet access for work or work-related activities. The hypothesis was supported and there is a significant disparity in internet access for work between disability statuses (p < 0.01).
Internet Access For School and Online Learning
Among people with access to the internet for school and online learning in 2021, most were between the ages of 15-24 (66.13%). More people with internet access for school were between the ages 25-44 (22.22%) than 45–64-year-olds (9.92%) or people above 65 years old (1.72%). The ages of people with internet access for school and online learning in 2021 skews younger than internet access for home and work in 2021, which is to be expected. In the 2021 data, close to 5% of the people who reported having internet access for school and online learning also reported having a disability, and 95% did not have a disability. In total, 25,862,346 people in the United States reported having internet access for school and online learning in 2021.
In Figure 3, the difference in percentages of internet access for school and online learning between disabled and non-disabled people is illustrated by the shaded gray region and the dashed green line. Percentages of people with internet access for school were computed by dividing by the number of people with and without a disability enrolled in school in the United States. Similar to the data on work internet access, disability demographics were collected for people with school internet access starting in 2011. This graph depicts a decrease in the difference in percentages of internet access for school between 2013 and 2015 that levels out for the remaining six years. In 2011, 74% of non-disabled people had access to the internet for school and online learning, whereas only 20% of disabled people had internet access for school. In the past ten years, the difference has decreased to 41.5%, suggesting some efforts to close the digital divide, but much progress left to be desired.
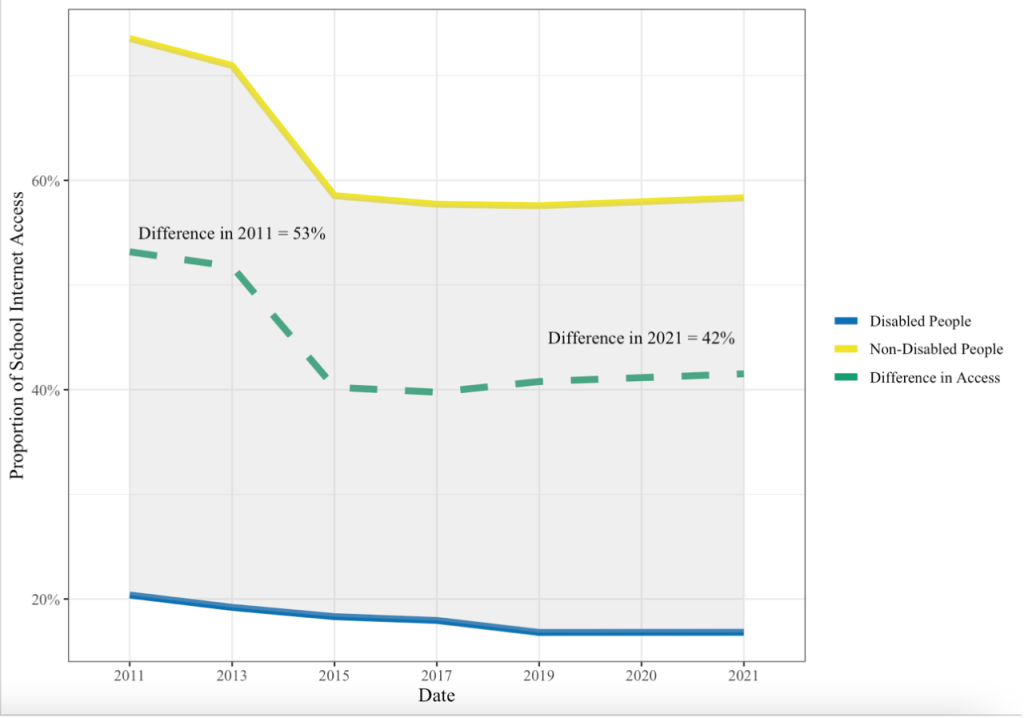
Figure 3
Percentage of Disabled and Non-Disabled People with Internet Access for School and Online Learning (2011-2021)
A Welch’s Two-Sample T-Test was conducted to compare the proportion of non-disabled people with internet access to the proportion of disabled people with internet access for school and online learning. Consistent with the digital divide, it was hypothesized that the proportion of non-disabled people with internet access for school is significantly larger than the proportion of disabled people with internet access for school. The hypothesis was supported (p < 0.01) and there is clear evidence of the digital divide for disabled people enrolled in school.
Exploring Income, Disability, and Internet Access
The data in this research recorded the number of people who do not have home internet access for a variety of reasons, including internet access being too expensive. Since prior studies found insufficient finances are the most common reason for a lack of internet access among disabled people, this research analyzed individuals who reported no internet access at home because it was “too expensive” in the National Internet Use Survey between 2010 and 2021 (U.S. Department of Labor, 2022). This study investigated whether disabled people struggle to afford internet access at disproportionate rates to non-disabled people in the United States, as well as the patterns of accessibility over time. Disabled people who reported no internet access due to its expense reached 21%, compared to 22% for non-disabled people in the survey.
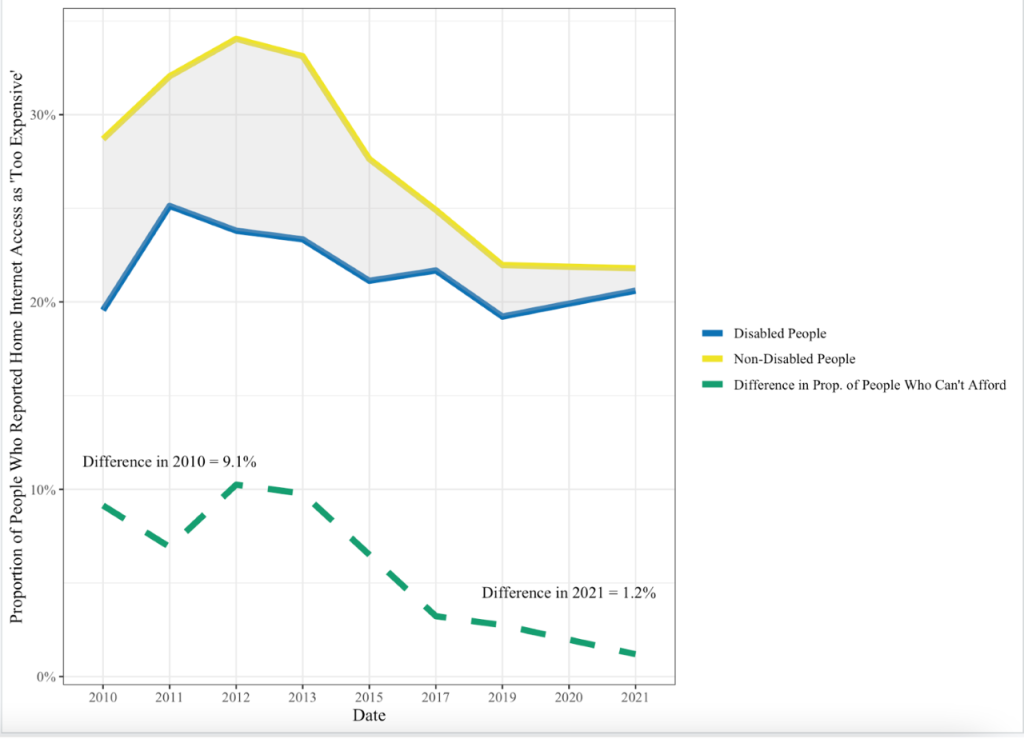
Figure 4
Percentage of Disabled and Non-Disabled People Who Reported Internet Access as “Too Expensive” (2011-2021)
As seen in Figure 4, the proportion of non-disabled people who reported not having internet access because it’s too expensive has decreased drastically in the last ten years. On the other hand, the proportion of disabled people who reported no internet access due to the cost has stayed relatively consistent. Proportions in this analysis were computed by determining the number of people who did not have internet access because it was too expensive out of the number of people who did not have internet access for all reasons[BL1] , including a lack of need or interest. More interestingly though, is the narrowing gap of the proportions between the two groups, especially from 2019-2021. This change suggests that the proportion of people who report internet access as “too expensive” is becoming more equal among disabled and non-disabled groups.
V. Analysis
The data analysis found the average proportion of non-disabled people with internet access at home is significantly larger than the average proportion of disabled people with internet access at home in the United States. In addition, it was found that disabled people have significantly less access to computers at home than non-disabled people. Differences in home internet access between disabled and non-disabled people have decreased drastically since data collection began in 2010, indicating progress in accessible practices.
Based on the findings, people with a disability have significantly less internet access for work, job searches, and managing finances than non-disabled people. Since data collection of disability demographics for people with work internet access began in 2011, the divide in work internet access has been closing, shown by decreasing differences between disabled and non-disabled people.
In terms of schooling in the United States, the analysis revealed that the proportion of disabled people with internet access is significantly less than the proportion on non-disabled people with internet access for coursework and online learning. Not only is internet access for school significantly less accessible for disabled people, but accessibility rates have remained constant since 2015, showing little progress. Overall, the secondary analysis found that although the digital divide is closing between disabled and non-disabled people for home and work internet access, the differences in internet access for work, school, and home remain significant and accessibility efforts can be increased.
The findings of this research were consistent with similar studies examining differences in internet access between people with and without disabilities. A 2021 study by the Pew Research Center found a significant difference between people with a disability and without a disability who own computers and smartphones (Perrin & Atske, 2021). The Pew Research study echoes these findings, revealing a significant difference in access to the internet or a computer between people with and without disabilities.
Other studies which discovered a significant digital divide between people with and without disabilities chose to analyze other socio-economic factors in conjunction with disability status. A 2017 study on European internet access analyzed how income, age, and marital status work with disability status to predict internet access. The study found that the negative effects of income, age, and marital status on internet access are multiplied when the person has a disability (Scholz et al., 2017). This was found to be consistent with the disparities analyzed in this research. Lastly, previous research from the Department of Labor focused on the obstacles stopping people with a disability from receiving equal access to the internet. Their study revealed that cost or insufficient finances were the most common reasons causing the difference in internet access among disabled people (U.S. Department of Labor, 2022). This research did not analyze causes for the divide or effects of the divide, but rather evidence of the divide in today’s digital environment, although these questions would be beneficial for future studies.
The income analysis may reveal an important implication about the lasting impact of legislation debated and passed in 2011. The United States in 2011 endured a crisis where government parties could not agree on whether to raise the national debt ceiling (MacAskill, 2011). This led to the delayed approval of the 2011 fiscal budget, putting the U.S. moments away from a government shutdown (Amadeo, 2021). In addition to the conflict, economic growth decreased drastically in the first quarter of 2011 (Kollewe, 2011). As a response to the government dispute and diminishing budgets, the U.S. Department of Treasury suspended investments into the Civil Service Retirement and Disability Fund (CSRDF), which provides benefits to disabled Federal employees (Irving & Engel, 2012). The culmination of a potential government shutdown, slowed economic growth, and cuts to benefits for disabled Federal employees could contribute to the increase in the percentage of disabled people who could not afford internet access in 2011, compared to 2010 and the years following. While non-disabled people seemed to recover from these circumstances and the proportion of people who reported internet access as “too expensive” decreased almost 7% between 2010 and 2021, the proportion of disabled people who could not afford internet access increased 1%. This change suggests that disabled people may take longer or require more resources to recover from financial crises than non-disabled people.
VI. Conclusion
This research into the digital divide is not without its limitations. Populations of people in the United States, employed people in the United States, and people enrolled in school in the United States were obtained from three separate sources with their own methods of estimation. Data collected about the total population in the United States was obtained from the U.S. Census taken each year since 2010. Population estimates for the total number of employed people and total number of disabled, employed people in the United States were obtained from the Bureau of Labor Statistics’ annual population survey from 2011 to 2021. Next, populations of non-disabled and disabled people enrolled in school were collected from research by the Individuals with Disabilities Education Act’s Office of Special Education Programs between 2011 and 2021. While these population estimates are expected to be mostly accurate, they are not exact and may not capture all the variability within the population. This research only accounted for socioeconomic factors of population proportion and income, while other factors may influence people’s access to the internet. Factors such as education level and age may prove to be confounding in the relationship, increasing the disparities between people with disabilities and people without. Lastly, criteria for determining internet access at home, work, and school may be lacking in robustness, since there may be reasons people access the internet in these locations that do not pertain to the questions asked in the survey. To combat this, future studies could analyze internet access between disabled and non-disabled people for each activity individually.
Further research could be conducted to analyze the reasons for the digital divide between disabled and non-disabled people, and other socio-economic factors which increase the divide beyond the change in the digital divide this study focused. For example, this research found significant differences in internet access between disabled and non-disabled people for the last ten years. However, the study also found that the differences were decreasing for internet access at home and work. Future research could be conducted to determine if the digital divide is narrowing significantly throughout time. In addition, there are a plethora of reasons why disabled and non-disabled people might not have internet access or might not want internet access. Studies could be conducted to examine the reasons why people do not have internet access, such as personal preference or lack of need. This research would help better explain the differences in internet access and account for people who do not want access to the internet. Lastly, factors such as education level may be related to disability status or income. For example, disparities in education may cause disabled people to have less access to jobs or lower incomes than non-disabled people. With a lower income or unstable career, the disabled person may not be able to afford internet access. In this way, further studies should analyze multiple socio-economic factors and their relationship to people with a disability’s internet access.
In an increasingly digital world, much of media, news, and information is distributed through online platforms. People have computers in their home that they use for entertainment, personal laptops for work, job searches, or managing finances, and internet access within school systems. Activities in people’s daily lives are being moved into a digital environment, which poses a threat to those with limited access to these services.
This research implies that despite increased accessibility efforts in the past ten years, more can be done to close the gap between the two groups. Disabled people are at a disadvantage when it comes to accessing the internet for entertainment at home, online learning, training courses, job searches, work, and managing finances. Limitations in these daily activities can lead to bigger economic disparities for people with disabilities as their lack of internet access keeps them from advancing in their careers, schools, and personal lives.
Acknowledgements
My completion of this research would not have been possible without the guidance, support, and expertise of Dr. Byung Lee—thank you for your advisement. I cannot express enough gratitude for your advice, along with the Elon Journal reviewers and Elon University School of Communications faculty for your time and appraisal.
References
Amadeo, K. (2021). The surprising truth about the U.S. debt crisis. The Balance. Retrieved from https://www.thebalancemoney.com/us-debt-crisis-summary-timeline-and-solutions-3306288.
Bach, A., Shaffer, G., & Wolfson, T. (2013). Digital human capital: Developing a framework for tnderstanding the economic impact of digital exclusion in low-income communities. Journal of Information Policy, 3, 247–266. https://doi.org/10.5325/jinfopoli.3.2013.0247 .
Bonfadelli, H. (2002). The internet and knowledge gaps. European Journal of Communication, 17(1), 65–84. https://doi.org/10.1177/0267323102017001607.
Bray, M., Pugalee, D., Flowers, C. P., & Algozzine, B. (2007). Accessibility of middle schools’ web sites for students with disabilities. The Clearing House: A Journal of Educational Strategies, Issues and Ideas, 80(4), 169–178. https://doi.org/10.3200/tchs.80.4.169-178.
Bureau of Labor Statistics. (2022, Oct. 29). Labor force statistics from the current population survey. Retrieved from https://www.bls.gov/cps/.
Chatman, E. A., & Pendleton, V. E. M. (1995). Knowledge gap, information-seeking and the poor. The Reference Librarian, 23(49-50), 135–145. https://doi.org/10.1300/j120v23n49_10.
Coppula, D. (1997). Diversity: Engineering accessibility. ASEE Prism, 7(1), 14–14. http://www.jstor.org/stable/24156145.
Cullen, R. (2001). Addressing the digital divide. Online Information Review, 25(5), 311-320. https://doi.org/10.1108/14684520110410517.
Gaziano, C. (2016). Knowledge gap: History and development. The international encyclopedia of media effects, 1–12. https://doi.org/10.1002/9781118783764.wbieme0041.
Hassani, S. N. (2006). Locating digital divides at home, work, and everywhere else. Poetics, 34(4-5), 250–272. https://doi.org/10.1016/j.poetic.2006.05.007.
Hirblinger, A. T. (2020). Understanding digital inclusion. In Digital inclusion in mediated peace processes: How technology can enhance participation (pp. 8–10). U.S. Institute of Peace. http://www.jstor.org/stable/resrep26644.5.
Kollewe, J. (2011, July 29). US economic growth slows down sharply in 2011. The Guardian. Retrieved from https://www.theguardian.com/business/2011/jul/29/us-economic-growth-slows-down-sharply.
Kulkarni, M. (2019). Digital accessibility: Challenges and opportunities. IIMB Management Review, 31(1), 91–98. https://doi.org/10.1016/j.iimb.2018.05.009.
Lieberman, M. (2021, Sept. 15). Internet access is a civil rights issue. Education Week. Retrieved from https://www.edweek.org/technology/internet-access-is-a-civil-rights-issue/2020/09.
MacAskill, E. (2011, July 29). US debt crisis: Republicans abandon vote as deadline looms. The Guardian. Retrieved from https://www.theguardian.com/business/2011/jul/29/us-debt-crisis-republican-bill.
Muller, C. (2022, July 11). What is the digital divide? Internet Society. Retrieved from https://www.internetsociety.org/blog/2022/03/what-is-the-digital-divide/.
National Telecommunications and Information Administration. (2021). NTIA Data Explorer. Retrieved from https://www.ntia.doc.gov/data/explorer#sel=schoolInternetUser&demo=disability&pc=prop&disp=chart.
Pérez-Escolar, M., & Canet, F. (2022). Research on vulnerable people and digital inclusion: Toward a consolidated taxonomical framework. Universal access in the information society, 1–14. Retrieved from https://doi.org/10.1007/s10209-022-00867-x.
Perrin, A., & Atske, S. (2021). Americans with disabilities less likely than those without to own some digital devices. Pew Research Center. Retrieved from https://www.pewresearch.org/fact-tank/2021/09/10/americans-with-disabilities-less-likely-than-those-without-to-own-some-digital-devices/.
Ragnedda, M. (2018). Tackling digital exclusion. Global Agenda for Social Justice, 1, 151–158. https://doi.org/10.2307/j.ctv47wfk2.23.
Scholz, F., Yalcin, B., & Priestley, M. (2017). Internet access for disabled people: Understanding socio-relational factors in Europe. Cyberpsychology: Journal of Psychosocial Research on Cyberspace, 11(1). https://doi.org/10.5817/cp2017-1-4.
Shearer, E. (2021, January 12). More than eight-in-ten Americans get news from digital devices. Pew Research Center. Retrieved from https://www.pewresearch.org/fact-tank/2021/01/12/more-than-eight-in-ten-americans-get-news-from-digital-devices/.
Simeone, J. (2007). Website accessibility and persons with disabilities. Mental and Physical Disability Law Reporter, 31(4), 507–511. http://www.jstor.org/stable/20787031.
Smith, A. (2020, September 18). Public attitudes toward technology companies. Pew Research Center: Internet, Science & Tech. Retrieved from http://www.pewresearch.org/internet/2018/06/28/public-attitudes-toward-technology-companies/.
U.S. Department of Education. EDFacts Data Warehouse (EDW): IDEA Part B child count and educational environments collection, 2012-19. Retrieved from http://go.usa.gov/xdp4T.
U.S. Department of Labor. (2022). Disability and the digital divide: Internet subscriptions, internet use, and employment outcomes. Office Of Disability Employment Policy. Web.
U.S. Government Accountability Office. (2015, November 9). Debt limit: Analysis of 2011-2012 actions taken and effect of delayed increase on borrowing costs. Retrieved from https://www.gao.gov/products/gao-12-701.
United States Census Bureau. (2021). Current population survey. Retrieved from https://www.census.gov/programs-surveys/cps/data.html.
van Dijk, J. A. G. M. (2006). Digital divide research: Achievements and shortcomings. Poetics, 34(4-5), 221–235. https://doi.org/10.1016/j.poetic.2006.05.004.
Williams, G. H. (2012). Disability, universal design, and the digital humanities. In M. K. Gold (Ed.), Debates in the digital humanities (pp. 202–212). University of Minnesota Press. http://www.jstor.org/stable/10.5749/j.ctttv8hq.15.