Fall 2025: Charlotte Turner
Beyond the Fine Print: Eye-Tracking the Influence of Icon Placement in Privacy Policies
Charlotte Turner
Strategic Communications and Media Analytics, Elon University
Submitted in partial fulfillment of the requirements in an undergraduate senior capstone course in communications
Abstract
As digital privacy policies continue to expand in length and complexity, users frequently engage with them without fully understanding the actual content, contributing to the phenomenon of uninformed consent. This research project investigates how one specific type of visual element— icons, influences user viewing experience and memory of privacy policies. Two between-subjects eye-tracking experiments were conducted with a total of 40 Generation Z participants. Study 1 examined whether the presence/absence of icons in a privacy policy influenced memory and visual attention. Study 2 explored whether the positioning of icons (left alignment vs. alternating alignment) affected visual attention and information retention. Results from both studies showed that the presence of icons improved user engagement and memory of policy content, while consistent left-aligned placement of icons supported a more structured and focused reading experience. These findings underscore the potential of visual design to reduce cognitive load and enhance ethical data comprehension, particularly for younger digital audiences.
Keywords: eye-tracking, icons, privacy policy, information processing
Email: cturner22@elon.edu
Introduction
Comprehending privacy policies has become essential in an increasingly digital world. Users provide many aspects of their identity online through these privacy policies and are empowered to determine the use of their personal information. Yet, according to a 2017 Deloitte study, over 90% of participants accepted a privacy policy without even reading the content. In the Deloitte study, users carelessly agreed to abnormal conditions such as granting naming rights to their firstborn child, allowing access to the airspace above their property for drone traffic, and giving their mother full access to their online browsing history (Cakebread, 2017).
Although online interactions are frequent, many users struggle to critically analyze and understand the privacy policies they consume. Almost all online platforms now provide privacy policies. One in four Americans is asked to agree to some form of privacy policy every day (Howarth, 2023). These documents are intended to inform users about their rights, obligations to a service, and overall use of their data. However, the overwhelming presence of legal jargon and dense document formatting often discourages users from fully reading the content. Despite their critical role in the digital atmosphere, a notable disconnect exists between the intention of these privacy policies and actual user memory. According to a study conducted by Obar and Oeldorf-Hirsch (2020), 74% of users skipped a privacy policy agreement, yet 97% agreed to the policy they skipped. This disengagement poses a significant risk, as users often accept terms without fully understanding them.
The consequences of lacking recollection of information can be severe and lead to privacy risks, uninformed consent, and potential violations of user rights (Zhu & Zhang, 2025). Privacy policies help users understand their essential rights and how their personal information can be used by corporations or service providers (Steinfeld, 2015). However, how users currently engage with these policies raises serious concerns about both their memory and the effectiveness of such privacy policies. This gap highlights the importance of user-centered design in privacy policies, which this study aims to address.
To address this research aim, two experiments were conducted to investigate how the presence and the positioning of icons influence users’ eye movement patterns and memory when viewing online privacy policies. In the first experiment, participants viewed either a traditional, text-heavy policy or a redesigned version enhanced with relevant icons. In the second experiment, all participants viewed policies containing icons, but with differing icon placements: one with all icons aligned to the left, and the other with icons alternating across sections. By exploring the relationship between icon design and user engagement across both experiments, this research offers valuable insight into how privacy policies can be made more user-friendly and effective in communicating critical information.
Literature Review
As digital life becomes increasingly data-driven, privacy policies have become a routine part of user experience. In a survey distributed by the Pew Research Center, almost a quarter of US adults said they are asked to agree to a privacy policy daily (Auxier, et al, 2019). Despite their importance, these documents are often dense, hard to understand, and frequently ignored. Research on cognitive load, interface design, and user behavior highlights how document complexity and poor formatting create significant barriers to comprehension and increase extraneous cognitive load (Faudzi et al., 2024). By implementing changes in document design and including iconography within policies, users can easily comprehend and digest the documents they consume daily (Interaction Design Foundation, 2024). Eye-tracking is an effective way for researchers to assess the tangible impact of visual elements integrated in complex documents. This technology allows researchers to explore these challenges in detail— particularly how design choices and elements, such as icons, affect attention and retention.
Cognitive Load & Legal Document Comprehension
Cognitive load theory, created by psychologist John Sweller, offers a helpful lens for understanding why privacy policies are so difficult to engage with (Sweller, 1988). Intrinsic load refers to the natural complexity of information, while extraneous load stems from how the information is presented (Paas et al., 2004). Dense formatting and legal jargon increase both of these loads, making users more likely to skim or skip content entirely due to the high amount of cognitive ability necessary for comprehension. As Wang et al. (2014) demonstrated, highly complex website content could lead to increased fixation counts and longer reading times, which signal greater mental effort of users.
This overload contributes to the “consent fallacy,” where users give superficial agreement to terms they don’t fully understand (Cofone, 2023). A user’s behavior regarding their privacy and security depends upon understanding a policy that outlines threats, risks, and impacts of data usage (Redmiles et al, 2020). This highlights the importance of viewers understanding policies that contain private information and personal data. Yet, there is still a disconnect between informed consent and active consent. In a Carnegie Mellon study, researchers determined that it would take roughly 76 workdays each year for the average person to read all the privacy policies they “agree” to (Hasan, 2022). Consent fallacy exists heavily in relation to privacy policies due to users being given policies that they do not fully read due to the complex language alone. In fact, Obar and Oeldorf-Hirsch (2020) found that most people admit to ignoring privacy policies altogether, even though they’re aware it may be risky. The gap between perceived understanding and actual comprehension raises ethical concerns about the legitimacy of digital consent due to the current design layout of these policies.
Generation Z & Data Practices
This study focused on Generation Z, specifically college students aged 18–25, due to their high digital engagement and frequent exposure to privacy policies. According to the Talker Research 2024 media consumption survey, Generation Z consumes more media daily than any other generation, averaging 6.6 hours per day across online platforms (Talker Research, 2024). This near-constant digital presence makes them more likely to encounter data collection prompts, consent of information requests, and privacy policy disclosures on a regular basis.
While Generation Z is highly active on digital platforms, they are not necessarily data literate. They tend to multitask, skim content, or overlook the details of content. In one study, 83% of Generation Z students self-reported using multiple screens at once on a consistent basis (Native, 2024). A 2023 survey found that 88% of Generation Z admitted to being willing to share some personal data with social media companies, compared to only 67% of older adults, reflecting a higher tolerance for data exchange for personalized experiences online (Wyman et. al, 2023). However, 75% of Generation Z respondents believe it is important that the social platforms they use protect their privacy, and many expressed concerns over others sharing their personal information without consent (Cohen, 2022).
This tension between habitual data sharing and strong privacy expectations makes Generation Z a critical demographic for studying how digital privacy policies can be redesigned for both clarity and practical comprehension. Their behavior highlights the importance of visual, accessible, and user-centered design principles in supporting informed consent.
Visual Design & Iconography in Privacy Policies
Visual elements and design features have been shown to provide a clear visual hierarchy to guide the eye to the most important elements on a page (Gordon, 2021). Visual hierarchy refers to the organization of design elements on a page, such as color, icons, contrast, and spacing. Other critical factors of effective document design include typography, layout, and icons (Hogan, 2024).
Icons are defined as “graphic symbols on a computer display screen that represent an app, an object, or a function (Merriam-Webster, n.d.). Iconography, in user experience design, refers to a visual language and simplified illustrations that can help users navigate digital environments (Interaction Design Foundation, 2024). According to Edwards and Abel (2014), standardized graphical approaches with icons are seen to work best for consumer recognition and uptake in reported consent. This success of comprehension with offline documents can be translated into digital policies.
Icons can help break up dense text, provide visual cues for navigation, and improve recall of key points within a policy. Rossi and Palmirani (2020) argue that effective visual design supports legal transparency, but warn that icons must be clear, intuitive, and consistently used within policies. Several studies show icons can increase trust and comprehension, especially when paired with relevant explanations (Cranor et al., 2020; Kitkowska et al., 2020). However, icons alone are not always successful. Habib et al. (2021) found that visual cues like toggles and dollar signs were frequently misunderstood without proper context. This highlights the importance of not just icon presence, but also their placement within a document and specific relation to document information. von Grafenstein et al. (2024) emphasize that structured visual layouts— such as consistent alignment and intuitive hierarchy— can strengthen a user’s sense of control and understanding. Iconography, when used intentionally, is a keyway to help create documents that are visually digestible and accessible for online users.
Using Eye-Tracking to Study the Influence of Icons
Eye-tracking studies offer unique insights into how users navigate digital documents and provide key metrics related to attention allocation during reading. Metrics like fixation counts, gaze duration, and scan patterns reveal which areas users pay attention to and which they avoid when viewing documents (Pauszek, 2023). Goldberg and Kotval (1999) emphasized how eye-tracking data helps evaluate engagement, comprehension, and information flow of content in online digital atmospheres. Eye-tracking technology functions by tracking the location of the eye up to one thousand times per second, allowing researchers to know precise fixations and areas of interest that a viewer has (Rayner et al., 2016).
When researching legal documents, this method has uncovered consistent trends. For example, users were found to often fixate on headings and visual elements but skip blocks of dense text (Steinfeld, 2015). By using eye-tracking in policy design research, we can better understand how layout, iconography, and structure influence reading behavior. By analyzing specific areas of interest and identifying the gaze patterns of individuals, we can determine where and when users view parts of a policy. In a study using a simplistic and fictitious privacy policy for a social platform, over half of the users admitted to miscomprehending the policy due to poor layout, use of unfamiliar language, and cognitive overload (Korunovska et al., 2020).
Past studies have explored icon use broadly. For example, Shen et al. (2018) investigated how users’ familiarity with objects depicted in icons affects cognitive performance during icon identification tasks. Michalski et al. (2006) also examined the effects of graphical interface design characteristics on human-computer interaction task efficiency. Few have focused on how icon placement and positioning affect user engagement and comprehension of privacy policies.
The presence or absence of icons has been a focal research area for document design. For example, Jin et. al (2023) investigated how different combinations of icon familiarity and the presence or absence of icons affect icon recognition. Mazza et. al (2022) explored the use of pictograms within a policy to improve the transparency of privacy agreements.
Through eye-tracking technology, researchers have explored how icons can help to increase user comprehension and positively impact reading habits of privacy policies (Vu et al., 2007). This positive impact is essential for enhancing the ethical communication of privacy policies. For Generation Z users, the common presence of uninformed consent with privacy policies is a severe issue if not appropriately addressed. Therefore, this study aims to fill that gap by analyzing how icon presence and positioning influence visual attention and memory by using eye-tracking methodology.
Study 1
The first study aims to understand whether the presence of icons in privacy policies enhances Generation Z’s reading experience and memory of privacy policies. It aims to explore the following research hypotheses.
H1. The presence of icons in privacy policies affects users’ eye movements.
H2. The presence of icons in privacy policies affects users’ memory of the policy content.
Study 1: Methods
Experiment Design
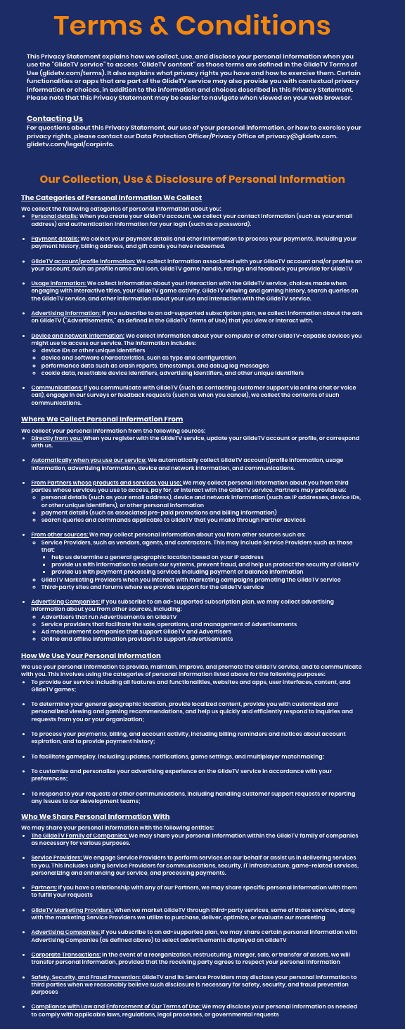
A between-participants lab experiment was conducted for Study 1. In this experiment, participants interacted with a mock webpage for a fictitious streaming service named “GlideTV.” They were asked to view the privacy policy of this service before deciding whether to subscribe to it. The privacy policy includes information regarding how the streaming service collects, uses, and discloses personal information. Specific sections of the policy include the type of personal information collected, where this data is stored, how personal data is used, and who personal information is shared with. The policy information was created by the researcher and inspired by Netflix’s privacy policy.
This experiment included two conditions: 1) the privacy policy with icons and 2) the privacy policy without any icons (See Figure 1). The content and overall layout of both privacy policies were the same. They only differed from each other regarding the presence or absence of icons. The policy with icons condition contains four outline icons visually representing the content of each respective section. The icons are placed in a left-alignment to reflect the natural left-aligned structure of documents, addressing topics of data privacy, data usage, and data sharing.
Procedure
The experiment took place in a controlled lab environment at Elon University. After providing informed consent and filling out a pre-test questionnaire about demographics, participants were instructed to sit at a desktop computer equipped with an eye-tracking device. They first completed a 5-point calibration process to ensure accurate tracking of their eye movements. They were then randomly assigned to view one of the two webpages displaying the privacy policy—either the text-heavy version without any icon or the text + icon version. There was no time limit for this viewing task. During the task, the fixation and duration of their eye movements were captured. Following the task, participants completed an online questionnaire assessing their memory of the privacy policy. At the end, they were thanked and debriefed about the study purpose.
 |
 |
Figure 1: GlideTV Privacy Policy Designs (Left: Policy without Icons, Right: Policy with Icons)
Data Collection & Measures
The study collected both eye movement data and self-reported data about memory of policy content. The eye movement data were collected by Gazepoint GP3 HD eye tracker with a 150Hz sampling rate. The key eye-tracking measures adopted in this study included fixation counts (i.e., number of times when the eye stops moving and focuses on something) and duration of policy viewing (i.e., time spent on viewing policy). These two measures help us understand user engagement with the content of policy. The average fixation of all participants was 3925.45 (SD = 2717.75). The average duration of viewing was 52.16 seconds (SD = 263.76).
Memory of policy was measured through self-reported post-test questionnaire about the key concepts of the policy, such as data usage and user rights, data collection, personal information sharing, and data storage. Six questions were asked with multiple choice answer options to cover the key sections of the policy (See Appendix A). The average percentage of correct answers across all participants was 79% (SD = 16.3).
Participants
Participants were recruited through word-of-mouth and announcements on the researcher’s social media. A total of 20 participants participated in this experiment. reflecting a mix of gender, academic backgrounds, and internet usage habits. All of them were Generation Z, ranging from 19 to 22 years old. Most were white, female, and seniors in college.
Study 1:Results
As shown in Table 1, the policy-with-icons condition led to longer viewing duration and more eye fixations than the policy-without-icons condition. It is interesting that compared to the policy-without-icons condition, the lower fixation-to-duration ratio in the policy-with-icons condition indicates that relative to the total viewing time, participants made fewer fixations on average. In other words, participants spent more time per fixation in the policy-with-icons condition. In addition, based on the results listed in Table 1, the policy-with-icons condition led to slightly better memory of policy content than the policy-without-icon condition.
Table 1: Eye-Tracking and Memory Outcomes by Conditions
| Average Duration (second) | Average Fixation Count | Average Ratio (Fixations/Duration) | Average Memory Score |
|
| Policy without Icons | 47.85 (SD = 478.5) |
3735.90 (SD = 2402.2) |
78.08 | 75% (SD = 18.9) |
| Policy with Icons | 56.47 (SD = 49.03) |
4115.00 (SD = 3033.3) |
72.87 | 83% (SD =11.7) |
Study 1: Discussion
Overall, the findings of Study 1 demonstrate that using icons could positively influence user engagement with privacy policy as shown by longer viewing time, more fixations, and better memory of privacy policy content in the policy-with-icons condition. The lower ratio of fixation by duration in the policy-with-icons condition is particularly important because it also means that each fixation lasts longer in this condition. In other words, the incorporation of icons to the text-heavy privacy policy, encouraged sustained attention rather than rapid skimming. The higher memory score in the policy-with-icons condition provides further evidence to support the idea that the integrations of icons enhanced engagement with policy content and supported greater understanding of information. It is worthwhile to note that the standard deviations of most outcome variables are slightly smaller in the policy-with-icons condition, implying a more consistent reading experience across participants in this condition.
These results suggest that even minor design interventions can make a difference on user interaction with complex privacy policies with unfamiliar jargons and terms. Incorporating icons into policies can improve navigation, promote deeper cognitive processing, and support more informed decision-making among Generation Z population. While Study 1 confirmed that the presence of icons could enhance user experience with privacy policies, Study 2 sought to understand whether and how the arrangement of icons, specifically, the positioning of them on the policy, could make an additional difference in guiding attention and improving retention.
Study 2
Building on the findings from Study 1 about whether using icons make a difference, Study 2 investigates how icon positioning impacts user eye movements and memory. Like Study 1, Study 2 adopted the same eye-tracking methodology but introduced a different experimental design with two between-participants icon conditions: left-aligned icon placement vs. alternating icon-text placement). It aimed to understand how subtle layout differences affect uses’ eye movements and information retention. In addition to examine users’ eye movement patterns at the entire document level, this study also aims to examine how viewing patterns differ by specific parts of the document, also referred to as areas of interest (AOIs) in eye-tracking context, such as different text and icon regions. The following are the research hypotheses explored in this study:
H1. Icon positions in privacy policies impact users’ eye movements 1) for the entire policy document and 2) for specific areas of interest (AOIs).
H2. Icon positions in privacy policies affect users’ memory of document content.
Study 2: Methods
Experiment Design
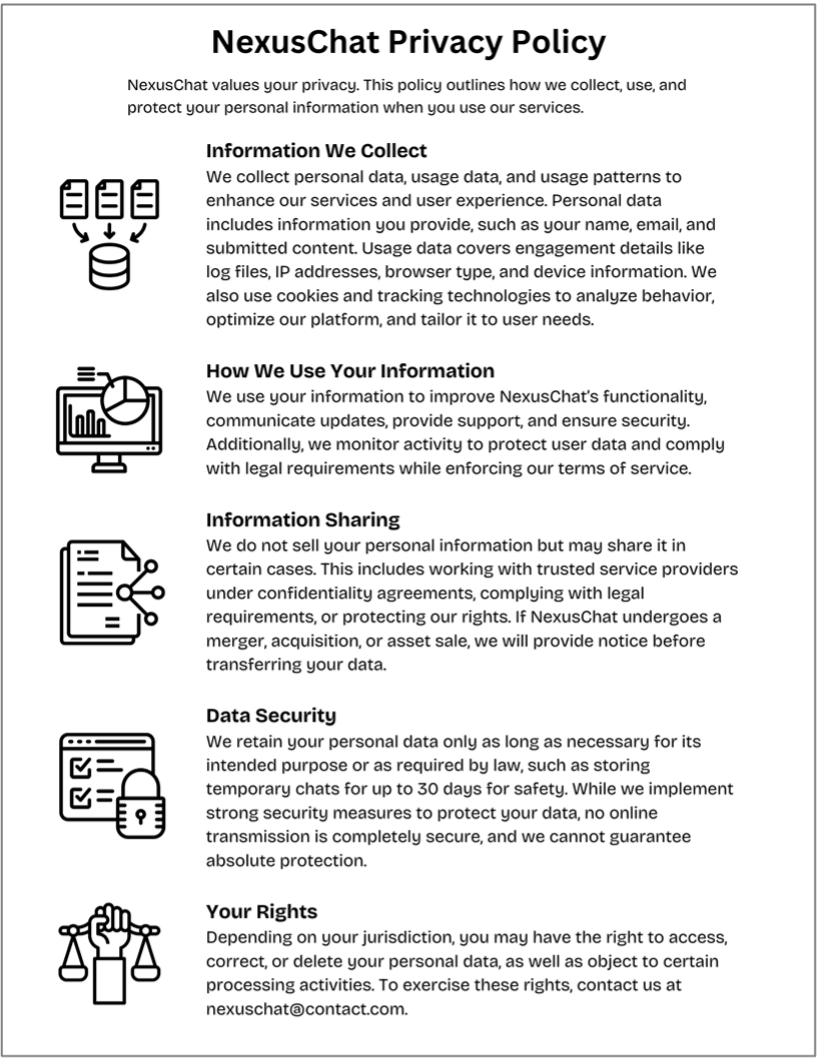
A between-participants lab experiment was conducted for Study 2. In this experiment, participants interacted with a mock privacy policy document for a fictitious AI chatbot service named “NexusChat.” They were asked to view the privacy policy of this service before completing a memory-related questionnaire. This privacy policy included information regarding types of data collected, how personal information is used, stored, and shared, as well as the users’ rights regarding their data. The policy text was created by the researcher and modeled after ChatGPT’s privacy practices and digital services.
This experiment included two conditions: 1) a privacy policy with all icons left-aligned, and 2) a policy with alternating icon positioning, where the same number of icons appeared on opposite sides of the document in a zigzag layout (See Figure 2). The content and overall structure of both policies remained exactly the same, with the only difference being the placement of the icons. Like Study 1, Study 2 used outline icons relevant to the content of each policy section. These icons show visual cues about data privacy, storage, usage, and access rights. These icons were selected from an online icon database the researcher to ensure visual consistency and clarity.
Procedure
This experiment also took place in a controlled lab environment at Elon University. After providing informed consent, participants first completed the eye-tracking calibration process like Study 1 and were then randomly assigned to view one of two versions of the NexusChat privacy policy. No time limit was set for this viewing task. During the task, their fixation count, viewing duration, and areas of interest (AOIs) were captured. After viewing the policy, participants completed an online questionnaire assessing their memory.
 |
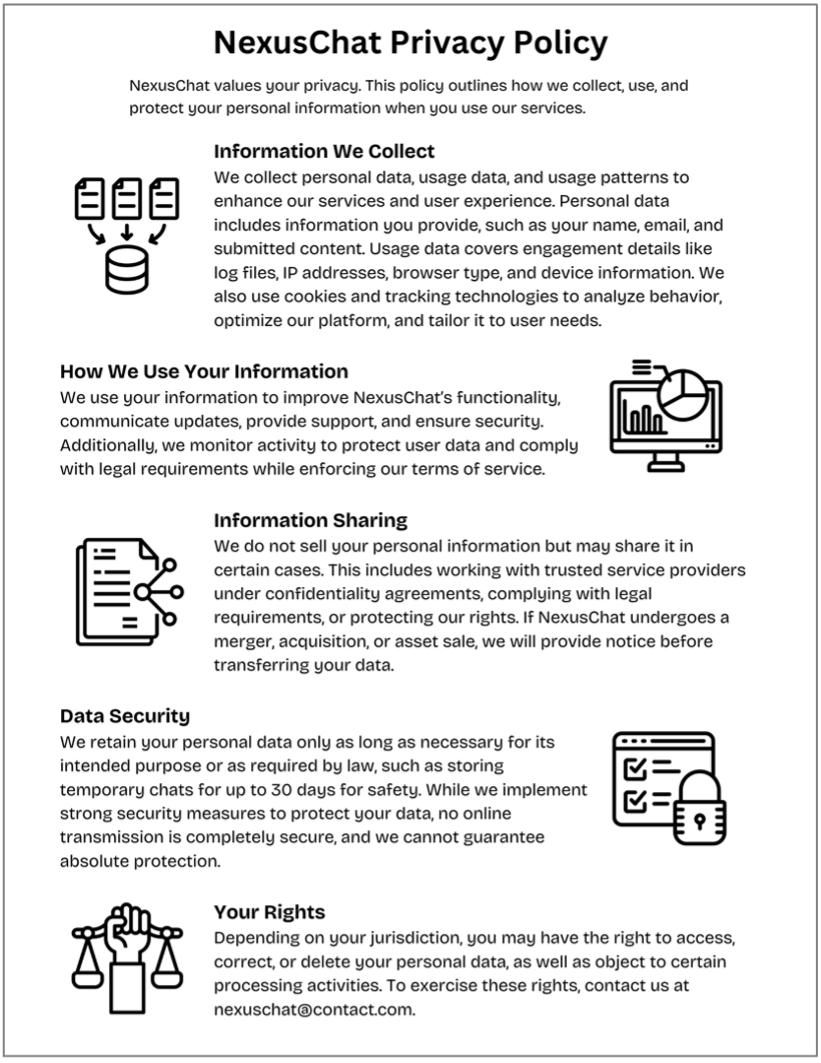 |
Figure 2: NexusChat Privacy Policy Designs
(Left: Policy with Left-Aligned Icon Placement, Right: Policy with Alternating Icons Placement)
Data Collection & Measures
Both eye movement data and self-reported memory data were collected in this study. Like Study 1, this study used the same Gazepoint GP3 HD eye tracker to capture fixation count. and session duration. The average number of fixations for the entire document was 129.1 (SD = 46.2) for all participants. The average viewing duration of the entire document was 57.9 seconds (SD = 23.2) for all participants.
In contrast to Study 1, Study 2 not only captured viewing duration for the entire document, but also for different areas of interest (AOIs), such as AOIs for icons and AOIs for text. The average time spent across icons was 0.595 seconds (SD = 0.35). The average time spent across text sections was 8.055 seconds (SD = 2.21). The areas of interest data also identified that 70% of all participants began reading the policy by viewing with the heading section first.
Participants’ memory of the policy information was assessed through six multiple-choice questions based on privacy policy content. The average percentage of correct answers was 72.5% (SD = 0.22) across all participants.
Participants
Participants were recruited through social media promotion, faculty referrals, and flyers distributed across Elon University’s campus. A total of 20 participants took part in this experiment, representing a range of academic majors, gender identities, and Internet literacy levels. All participants were members of Generation Z, aged between 19 and 22 years old.
Study 2: Results
As shown in Table 2, the left-aligned icon placement condition led to longer viewing duration and more eye fixations than the alternating icon placement condition. While the fixation-to-duration ratios between the two conditions were very similar, participants in the left-aligned placement condition demonstrated higher fixation counts overall than those in the alternating icon placement condition. Additionally, based on the results listed in Table 2, the left-aligned icon condition led to better memory, as indicated by a higher average memory score than the alternating icon placement condition.
As shown in Table 3, the left-aligned icon placement condition led to more average viewing time across the text areas than the alternating icon placement condition. It also led to greater average viewing time spend across the icon areas than the alternating icon placement condition.
Table 2: Eye-Tracking and Memory Outcomes by Conditions
| Average Duration (s) | Average Fixation Count | Average Ratio (Fixations/Duration) | Average Memory Score | |
| Left-Aligned Icon Placement | 60.39 (SD = 27.5)) |
134.0 (SD = 55.1) |
2.22 | 75% |
| Alternating Icon Placement | 55.50 (SD = 18.4) |
124.1 (SD = 37.3) |
2.24 | 70% |
Table 3: Areas of Interest Data by Condition
| Average Time Spent on Icon AOIs (s) | Average Time Spent Text AOIs (s) | |
| Left-Aligned Icon Placement | 0.65 (SD = 0.34) | 8.26 (SD = 2.42) |
| Alternating Icon Placement | 0.54 (SD = 0.40) | 7.85 (SD = 2.25) |
Study 2: Discussion
Overall, the findings of Study 2 suggest that icon positioning can meaningfully impact how users engage with and remember privacy policies. The left-aligned icon placement condition led to longer viewing times, higher fixation counts, and slightly better memory scores compared to the alternating icon placement condition. These differences indicate that consistent icon placement on the left side of the policy may support more structured and focused reading behavior, likely by aligning with users’ natural left-to-right reading patterns.
Although the fixation-to-duration ratios between the two conditions were very close, participants in the left-aligned condition spent slightly fewer fixations per duration. This may suggest deeper cognitive engagement with each viewing spot, given that a longer fixation often signals concentrated attention. However, it may also indicate the existence of distractions for participants to navigate across the juxtaposed texts and icons, given that a longer fixation could also suggest more effortful and challenging information processing due to confusion (Pauszek, 2023). In other words, the consistent visual layout made it easier for users to absorb the content without becoming disoriented or distracted by the shifting design layout.
Further evidence comes from the areas of interest (AOI) data. On average, participants in the left-aligned icon placement condition spent more time across the text areas, while maintaining more average viewing time across icon areas than those in the alternating icon placement condition. This suggests that a consistent placement of visuals cues not only helps users find information more easily, but also keeps them more engaged on all components of the policy, including both visuals and texts. However, the larger standard deviations in the left-aligned icon condition suggest that variability among user reading habits still exists despite icons’ placement.
Overall, these results indicate that even small layout differences, such as icon placement, can shape how effectively users process and retain complex policy information. For designers and digital policy creators, maintaining visual consistency and alignment may be key to supporting more informed and confident decision-making.
Overall Discussion & Conclusion
Both Study 1 and Study 2 explored how iconography influences user engagement and memory when interacting with privacy policies, each examining a different aspect of visual design. Study 1 focused on the presence versus absence of icons and found that including relevant icons improved user attention and memory, suggesting that visuals aids can enhance processing of otherwise dense and legalistic content. Study 2, on the other hand, examined how the positioning of icons, left-aligned versus alternating icon layout, shaped eye movement patterns and memory. While the effects were more subtle, the findings still demonstrated that a consistent layout with the left-aligned icons supported a more structured and attentive reading experience. Together, the two studies show that icon presence has a stronger influence than placement positions, while both could contribute meaningfully to how users engage with complex policy documents.
These findings carry important implications for the growing concern around uninformed consent—a phenomenon where users accept terms without truly understanding them (Ripley et al., 2018). Despite the critical role privacy policies play in outlining data usage and user rights, they are often overlooked or skimmed, especially by younger audiences (Wyman et. al, 2023). As Generation Z navigates a world of constant digital interactions, promoting ethical data comprehension is more important than ever. This research highlights the potential of iconography not just as visual enhancement, but as a tool for improving data literacy and supporting clearer, more accessible policy communication. Incorporating intentional, well-placed icons may be a small step, but it can pave the way for more transparent and user-centered digital environments.
Limitations
Several limitations should be considered when interpreting the results of this research. First, the small and relatively homogenous sample, primarily consisting of Generation Z college students, limits broader applicability of the findings across diverse populations. While participants represented a variety of academic backgrounds, racial and gender diversity remained limited. Additionally, the lab setting may have encouraged a more focused and deliberate reading behavior than what typically occurs during real-world interactions with privacy policies.
Participant motivation and prior familiarity with privacy policies like varied, potentially influencing engagement and memory of information. In Study 1, participants were unaware that their interaction with the privacy policy would be analyzed, whereas in Study 2, they were informed that the study involved privacy policy engagement. This created differing levels of expectation and attention between the two groups.
Another limitation of this research is the absence of inferential statistical testing, such as t-tests, which means the statistical significance of the data cannot be determined. As a result, this study remains descriptive in nature. Future research could incorporate additional statistical testing to more rigorously assess the differences between conditions.
Lastly, both studies relied on privacy policies of fictitious brands/services designed to mirror real-world scenarios. While realistic in tone and structure, these materials may not fully replicate the urgency, stakes, or multitasking behaviors associated with the actual consent experiences. Finally, the relatively subtle manipulation of icon placement in Study 2 may have contributed to more modest effects, suggesting that future research should examine a wider range of design changes to further understand how visual elements and layout impact user behavior.
Acknowledgements
I would like to thank Professor Laura Lacy for inspiring me to ambitiously pursue this research project through her Great Ideas course. I am especially grateful to Dr. Qian Xu for the confidence she instilled in me as a researcher. Her invaluable guidance, unwavering support, and thoughtful encouragement made this project possible.
References
Auxier, B., Rainie, L., Anderson, M., Perrin, A., Kumar, M., & Turner, E. (2019, November 15). Americans’ attitudes and experiences with privacy policies and laws. Pew Research Center: Internet, Science & Tech. https://www.pewresearch.org/internet/2019/11/15/americans-attitudes-and-experiences-with-privacy-policies-and-laws/
Cakebread, C. (2017). 91% of people consent to legal terms and services without reading them. Business Insider. https://www.businessinsider.com/deloitte-study-91-percent-agree-terms-of-service-without-reading-2017-11
Cofone, I. (2023). The consent illusion. In I. Cofone (Ed.), The privacy fallacy: Harm and power in the information economy (pp. 46-66). Cambridge University Press
Cohen, D. (2022, January 28). Snap, KR&I: Gen Z, millennials value privacy but don’t feel they’re getting enough of it. Adweek. https://www.adweek.com/media/snap-kri-gen-z-millennials-value-privacy-but-dont-feel-theyre-getting-enough-of-it/
Cranor, L. F., Habib, H., Zou, Y., Reidenberg, J., Sadeh, N., & Schaub, F. (2020). Design and evaluation of a usable icon and tagline to signal an opt-out of the sale of personal information as required by CCPA. https://cups.cs.cmu.edu/pubs/CCPA2020Feb04.pdf
Edwards, L., & Abel, W. (2025). The use of privacy icons and standard contract terms for generating consumer trust and confidence in digital services. CREATe Working Paper. https://www.create.ac.uk/publications/the-use-of-privacy-icons-and-standard-contract-terms-for-generating-consumer-trust-and-confidence-in-digital-services/
Faudzi, M. A., Cob, Z. C., Ghazali, M., Omar, R., & Sharudin, S. A. (2024). User interface design in mobile learning applications: Developing and evaluating a questionnaire for measuring learners’ extraneous cognitive load. Heliyon, 10(18), e37494–e37494. https://doi.org/10.1016/j.heliyon.2024.e37494
Goldberg, J. H., & Kotval, X. P. (1999). Computer interface evaluation using eye movements: methods and constructs. International Journal of Industrial Ergonomics, 24(6), 631-645. https://doi.org/10.1016/S0169-8141(98)00068-7
Gordon, K. (2021, January 17). Visual hierarchy in UX: Definition. Nielsen Norman Group. https://www.nngroup.com/articles/visual-hierarchy-ux-definition/
Habib, H., Alahmad, M., Bauer, L., Cranor, L. F., & Sadeh, N. (2021). Toggles, dollar signs, and triangles: How to (in)efectively convey privacy choices with icons and link texts. Proceedings of the 2021 CHI Conference on Human Factors in Computing Systems, 63, 1–25. https://dl.acm.org/doi/10.1145/3411764.3445387
Hasan, Z. (2022, March 24). Discussing privacy fallacies: Concluding thoughts. National Association of Attorneys General. https://www.naag.org/attorney-general-journal/discussing-privacy-fallacies-concluding-thoughts/
Hogan, D. (2021, January 23). The Most Important Factors in Effective Document Design. MadCap Software. https://www.madcapsoftware.com/blog/three-important-factors-in-effective-document-design/
Howarth, J. (2023, February 21). 23+ Alarming Data Privacy Statistics For 2023. Exploding Topics. https://explodingtopics.com/blog/data-privacy-stats
Interaction Design Foundation. (2024, May 2). What is readability in UX design? The Interaction Design Foundation. https://www.interaction-design.org/literature/topics/readability-in-ux-design?srsltid=AfmBOorPvrn6n9g7-jLLSyXem3UZSD12qL85utKyXqjMoFcv6toWgiq1
Jin, T., Wang, W., He, J., Wu, Z., & Gu, H. (2023). Influence mechanism of icon semantics on visual search performance: Evidence from an eye-tracking study. International Journal of Industrial Ergonomics, 93. https://doi.org/10.1016/j.ergon.2022.103402
Kitkowska, A., Warner, M., Shulman, Y. Wästlund, E., & Martucci, L., (2020). Enhancing privacy through the visual design of privacy notices: Exploring the interplay of curiosity, control and affect. Proceedings of the 16th Symposium on Usable Privacy and Security. https://www.usenix.org/system/files/soups2020-kitkowska.pdf
Korunovska, J., Kamleitner, B., & Spiekermann-Hoff, S. (2020). The challenges and impact of privacy policy comprehension. WU Vienna University of Economics and Business, 1–17. https://research.wu.ac.at/en/publications/the-challenges-and-impact-of-privacy-policy-comprehension-11
Masyura Ahmad Faudzi, Zaihisma Che Cob, Ghazali, M., Omar, R., & Sharul Azim Sharudin. (2024). User interface design in mobile learning applications: Developing and evaluating a questionnaire for measuring learners’ extraneous cognitive load. Heliyon, 10(18), e37494–e37494. https://doi.org/10.1016/j.heliyon.2024.e37494
Mazza, L. U., Fadrique, L. X., Kuang, A., Donovska, T., Vaillancourt, H., Teague, J., Hailey, V. A., Michell, S., & Morita, P. P. (2022). Exploring the use of pictograms in privacy agreements to facilitate communication between users and data collecting entities: Randomized controlled trial. JMIR Human Factors, 10, e34855. https://doi.org/10.2196/34855
McClain, C., Faverio, M., Anderson, M., Park, E. (2023). How Americans view data privacy. Pew Research Center. https://www.pewresearch.org/internet/2023/10/18/how-americans-view-data-privacy/
Merriam-Webster. (n.d.). Icon. In Merriam-Webster.com dictionary. https://www.merriam-webster.com/dictionary/icon
Michalski, R., Grobelny, J., & Karwowski, W. (2006). The effects of graphical interface design characteristics on human–computer interaction task efficiency. International Journal of Industrial Ergonomics, 36(11), 959–977. https://doi.org/10.1016/j.ergon.2006.06.013
Native. (2024). Mighty multitaskers – how Gen Z students are getting it all done. https://partner.native.fm/blog/mighty-multitaskers/
Obar, J. A., & Oeldorf-Hirsch, A. (2020). The biggest lie on the internet: Ignoring the privacy policies and terms of service policies of social networking services. Information, Communication & Society, 23(1), 128–147. https://doi.org/10.1080/1369118X.2018.1486870
Paas, F., Renkl, A., & Sweller, J. (2004). Cognitive load theory: Instructional implications of the interaction between information structures and cognitive architecture. Instructional Science, 32(1–2), 1–8. https://doi.org/10.1023/B:TRUC.0000021806.17516.d0
Pauszek, J. R. (2023). An introduction to eye tracking in human factors healthcare research and medical device testing. Human Factors in Healthcare, 3, 100031. https://doi.org/10.1016/j.hfh.2022.100031
Rayner, K., Schotter, E. R., Masson, M. E., Potter, M. C., & Treiman, R. (2016). So much to read, so little time: How do we read, and can speed reading help? Psychological Science in the Public Interest, 17(1), 4–34. https://doi.org/10.1177/152910061562326
Redmiles, E., Warford, N., Jayanti, A., Koneru, A., Stevens, R., Mazurek, M., Kross, S., & Morales, M. (2020). A comprehensive quality evaluation of security and privacy advice on the Web. Proceedings of the 29th USENIX Security Symposium. https://www.usenix.org/system/files/sec20-redmiles.pdf
Ripley, K. R., Hance, M. A., Kerr, S. A., Brewer, L. E., & Conlon, K. E. (2018). Uninformed consent? The effect of participant characteristics and delivery format on informed consent. Ethics & Behavior, 28(7), 517–543. https://doi.org/10.1080/10508422.2018.1456926
Rossi, A., & Palmirani, M. (2020). Can visual design provide legal transparency? The challenges for successful implementation of icons for data protection. Design Issues, 36(3), 82-96, https://doi.org/10.1162/desi_a_00605
Sandle, T. (2020, January 29). Report finds only 1 percent reads ‘Terms & Conditions’. Digital Journal. https://www.digitaljournal.com/business/report-finds-only-1-percent-reads-terms-conditions/article/566127
Shen, Z., Xue, C., & Wang, H. (2018). Effects of users’ familiarity with the objects depicted in icons on the cognitive performance of icon identification. I-Perception, 9(3). https://doi.org/10.1177/2041669518780807
Steinfeld, N. (2015). “I agree to the terms and conditions”: (How) do users read privacy policies online? An eye-tracking experiment. Computers in Human Behavior, 55(B), 992-1000. https://doi.org/10.1016/j.chb.2015.09.038
Sweller, J. (1988). Cognitive load during problem solving: Effects on learning. Cognitive Science, 12(2), 257–285. https://doi.org/10.1207/s15516709cog1202_4
Talker Research. (2024). Media consumption trend report. https://talkerresearch.com/wp-content/uploads/2024/09/Talker-Research-Media-Consumption-Trend-Report.pdf
von Grafenstein, M., Kiefaber, I., Heumüller, J., Rupp, V., Graßl, P., Kolless, O., & Puzst, Z. (2024). Privacy icons as a component of effective transparency and controls under the GDPR: Effective data protection by design based on art. 25 GDPR. Computer Law & Security Review, 52, 105924. https://doi.org/10.1016/j.clsr.2023.105924
Vu, K.-P. L., Chambers, V., Garcia, F. P., Creekmur, B., Sulaitis, J., Nelson, D., Pierce, R., & Proctor, R. W. (2007). How users read and comprehend privacy policies. Lecture Notes in Computer Science, 4558, 802–811. https://doi.org/10.1007/978-3-540-73354-6_88
Wang, Q., Yang, S., Liu, M., Cao, Z., & Ma, Q. (2014). An eye-tracking study of website complexity from cognitive load perspective. Decision Support Systems, 62, 1–10. https://doi.org/10.1016/j.dss.2014.02.007
Interaction Design Foundation. (2024, June 18). What is iconography? https://www.interaction-design.org/literature/topics/iconography?srsltid=AfmBOooOyZm4bzM6hP-Bec01Yty9k_w4szBbvOmlqc1myxBRU9ZiIe1x
Wyman, O., DeBrusk, C., & Kreacic, A. (2023, August 23). How Gen Z uses social media is causing a data privacy paradox. Oliver Wyman Forum. https://www.oliverwymanforum.com/gen-z/2023/aug/how-gen-z-uses-social-media-is-causing-a-data-privacy-paradox.html
Zhu, H., & Zhang, M. (2025). “I don’t get it, but I accept it.” Exploring uninformed consent to privacy policies: A neutralization perspective. Computers & Security, 153, 104396. https://doi.org/10.1016/j.cose.2025.104396