Sustainability

Sustainability explores the dynamic interconnections among environmental, social and economic systems in order to meet the needs of the present without compromising the ability of future generations to meet their own needs. This definition, which is based on one published in Our Common Future , demonstrates that sustainability is about more than protecting the environment. It is the balance of environmental, social and economic well-being. All three are needed for sustainability.
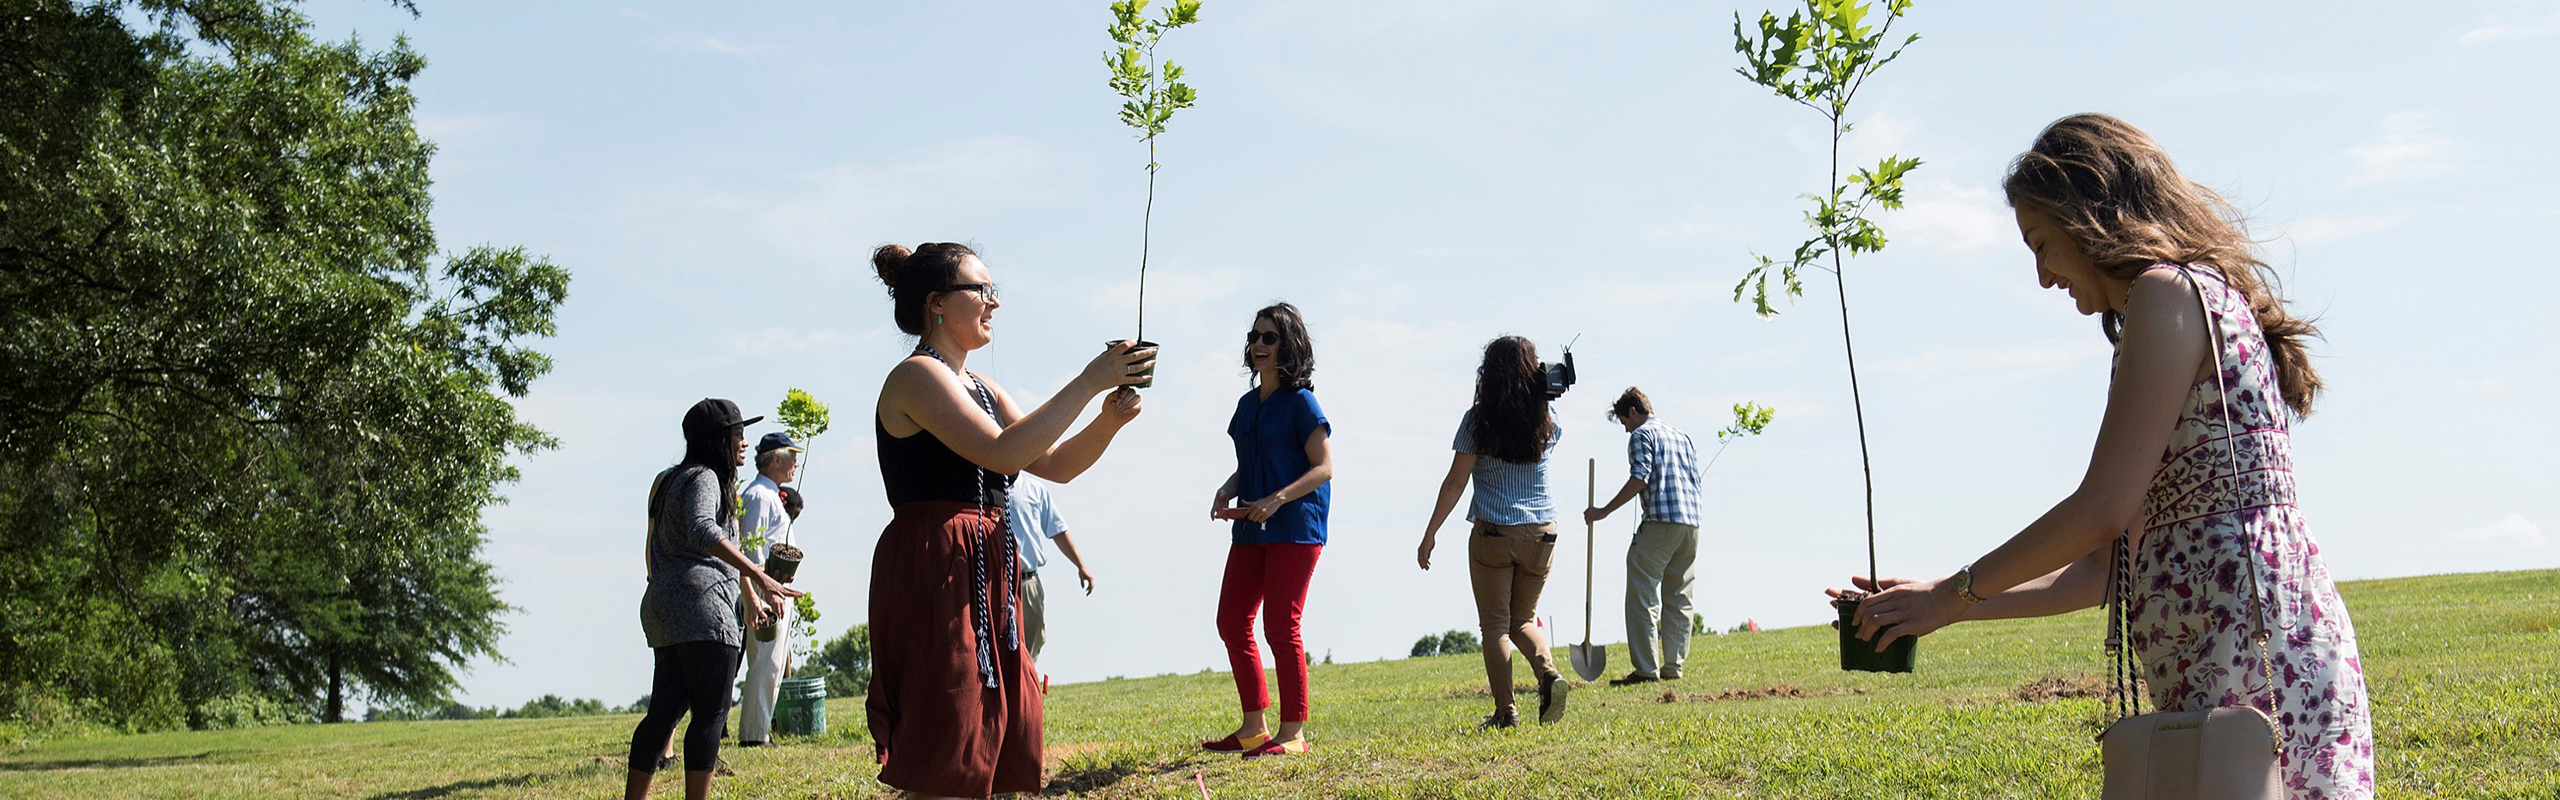
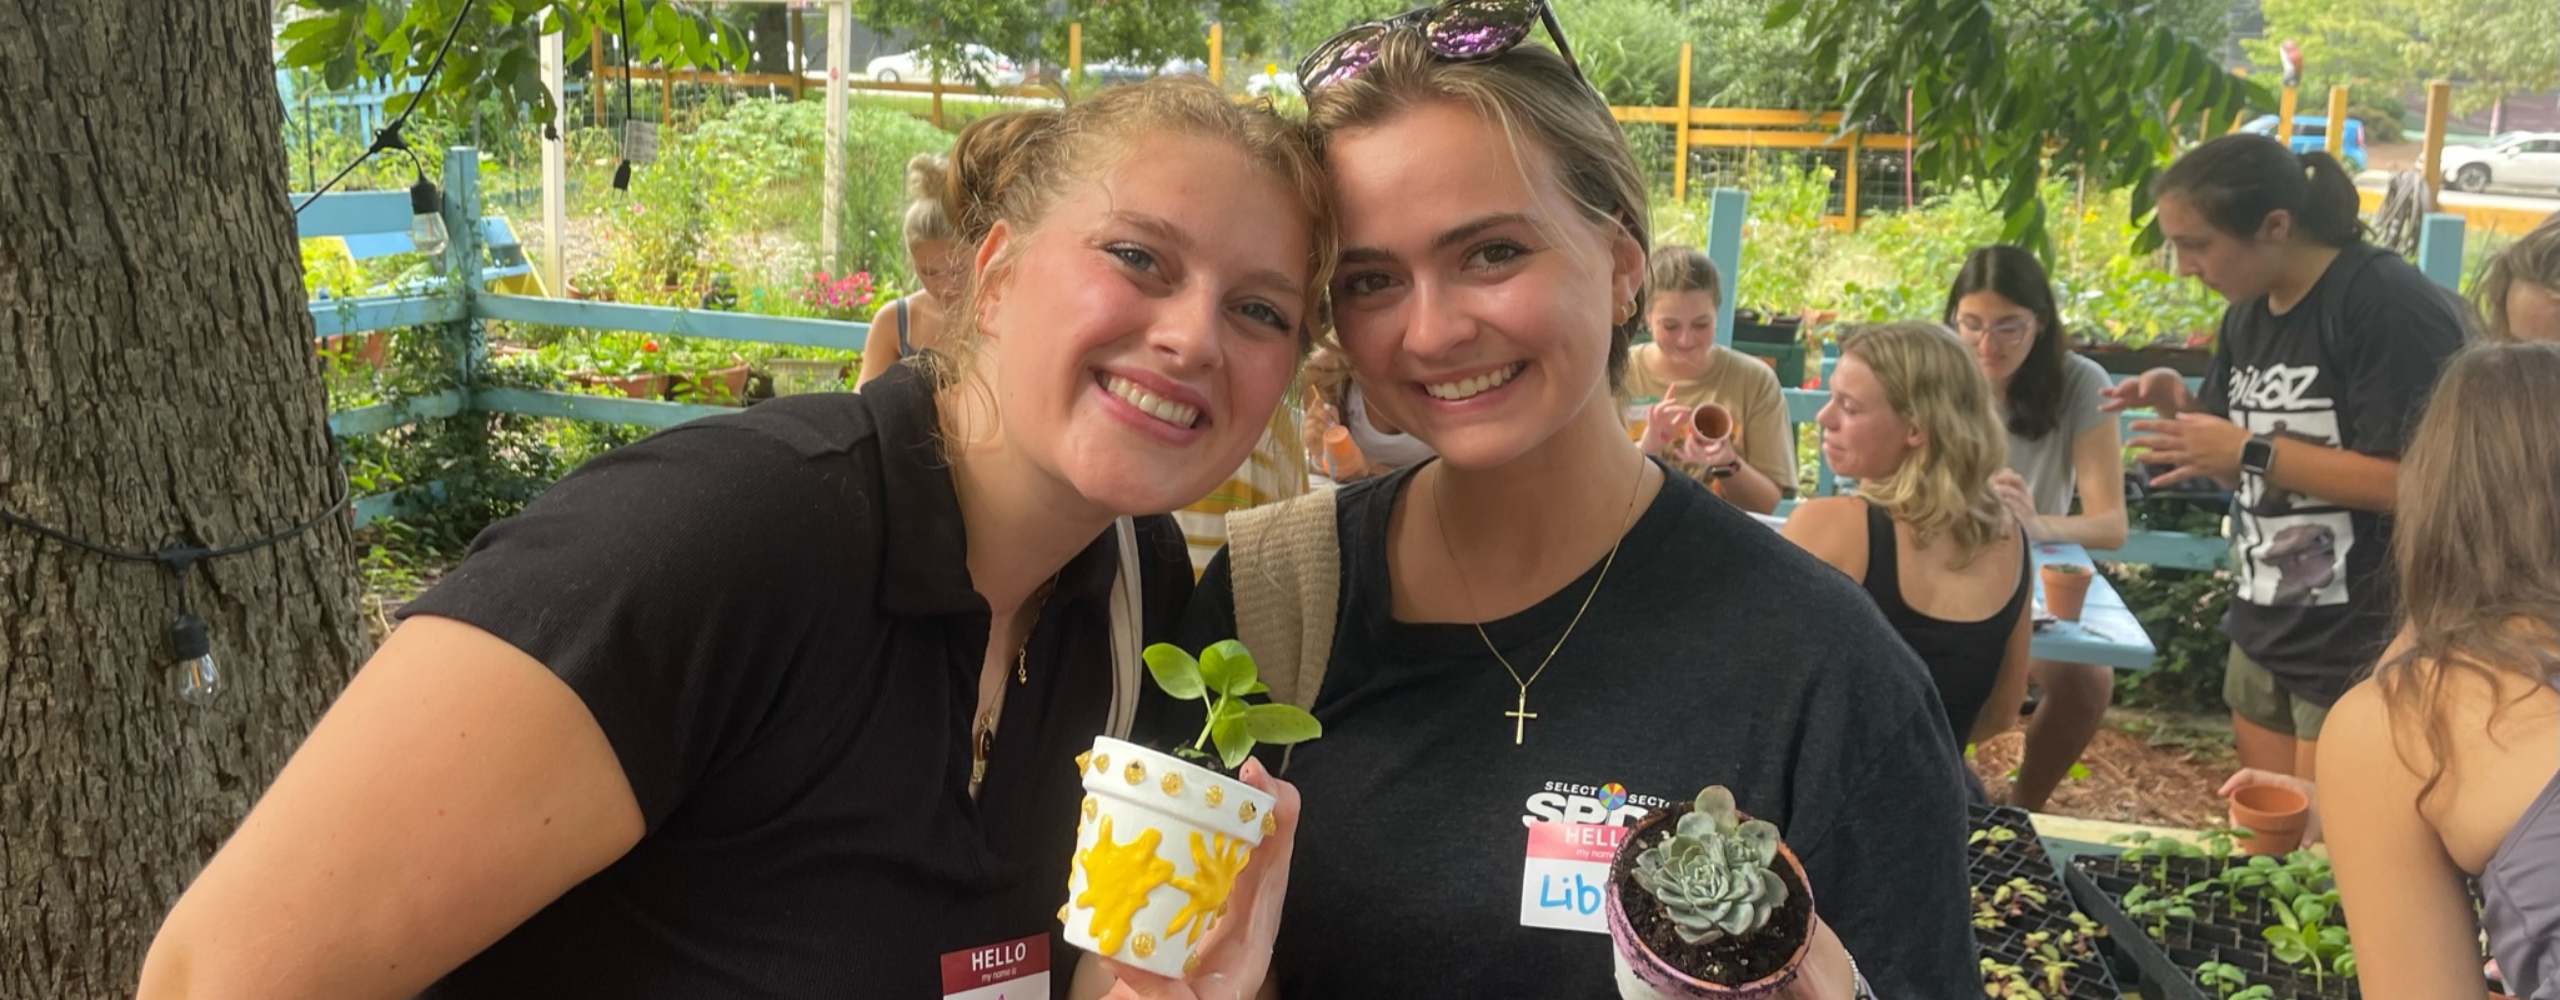
Sustainability is an institution-wide effort and a part of the Boldly Elon strategic plan. Elon’s success in achieving its sustainability goals largely depends upon every member of the campus community taking an active role.
From operations to educational programs, sustainability is integrated throughout campus and campus life. Elon’s environmental sustainability efforts are guided by the Sustainability Master Plan.
Elon is a STARS (Sustainability Tracking, Assessment & Rating System) participant and has earned a STARS Silver rating. The STARS program measures and encourages sustainability in all aspects of higher education.
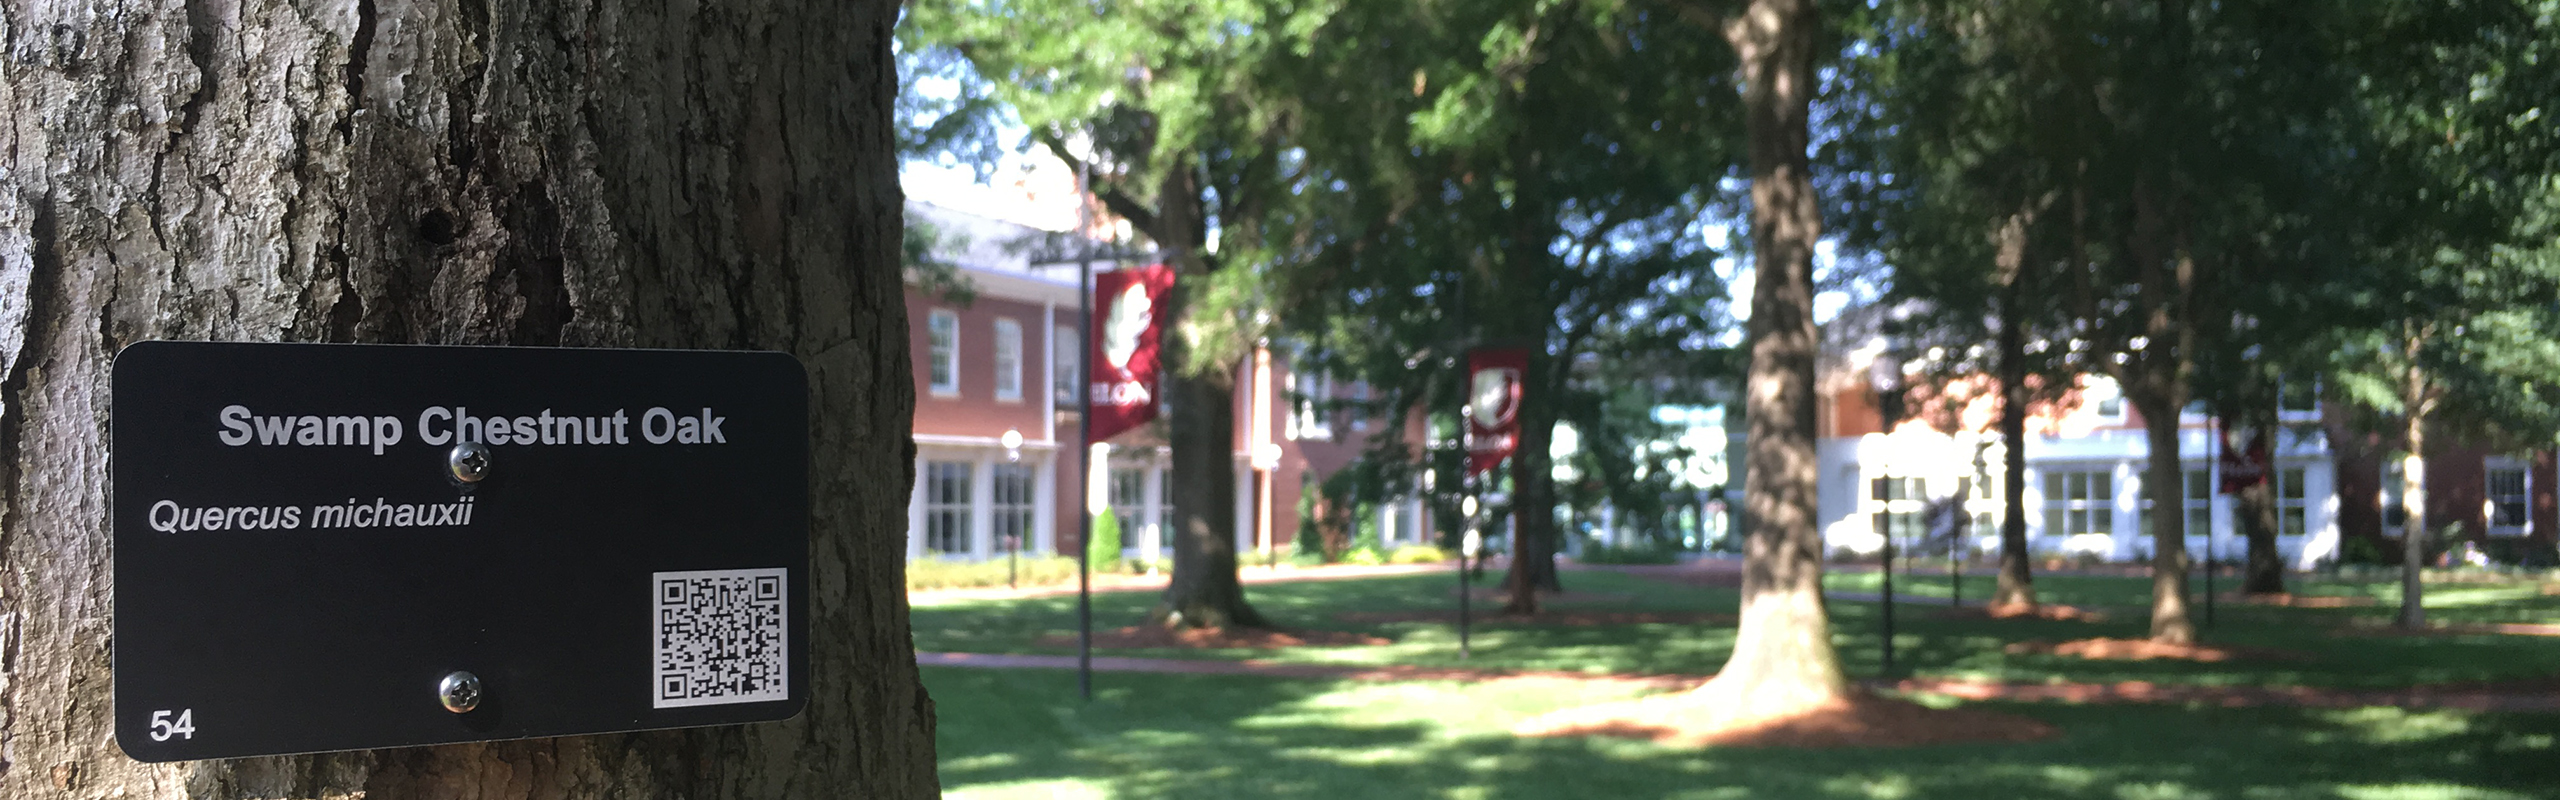
Take a self-guided walking tour highlighting some of Elon’s sustainability initiatives.
Connect